FIGURE 10.

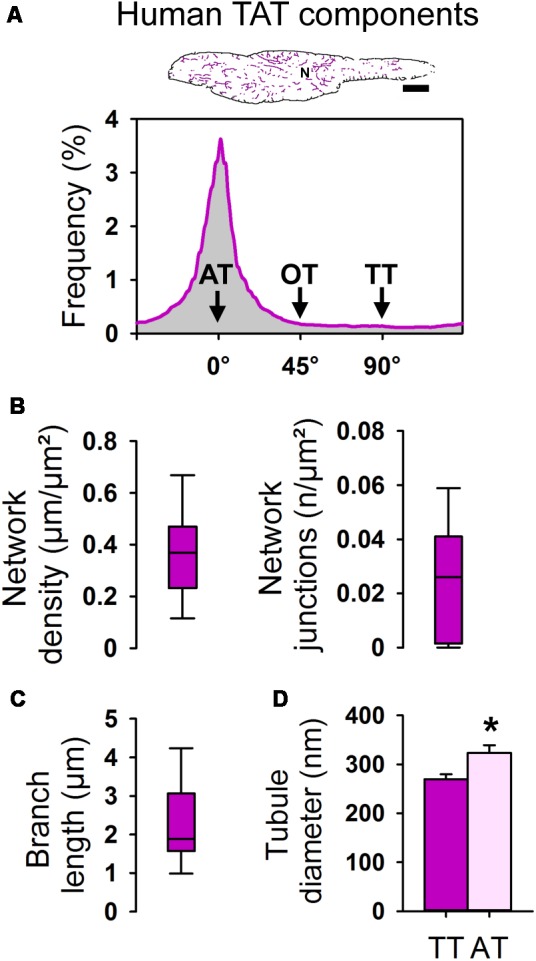
Component-specific TAT analysis of atrial myocytes in human tissue samples. (A) Skeleton representation (pink) of the WGA stained human AM from Figure 9D. Histogram analysis showing the frequency distribution of individual TAT components. The major peak represents abundant ATs (0°). N, nucleus. Scale bar 10 μm. (B) Box plots summarizing the TAT network density and the number of network junctions. (C) Box plot showing the branch length in human AM. Boxes represent the median, lower and upper quartiles, and whiskers the 5th and the 95th percentiles. n = 21 AMs in histological tissue sections from three patients. (D) Bar graph summarizing the AT and TT diameter (FWHM) as determined in WGA stained AMs in human tissue sections. n = 35 ATs and 17 TTs from 22 human AMs in tissue sections. Please see Supplementary Table S1 for clinical patient information. Student’s t-test ∗P < 0.05.
