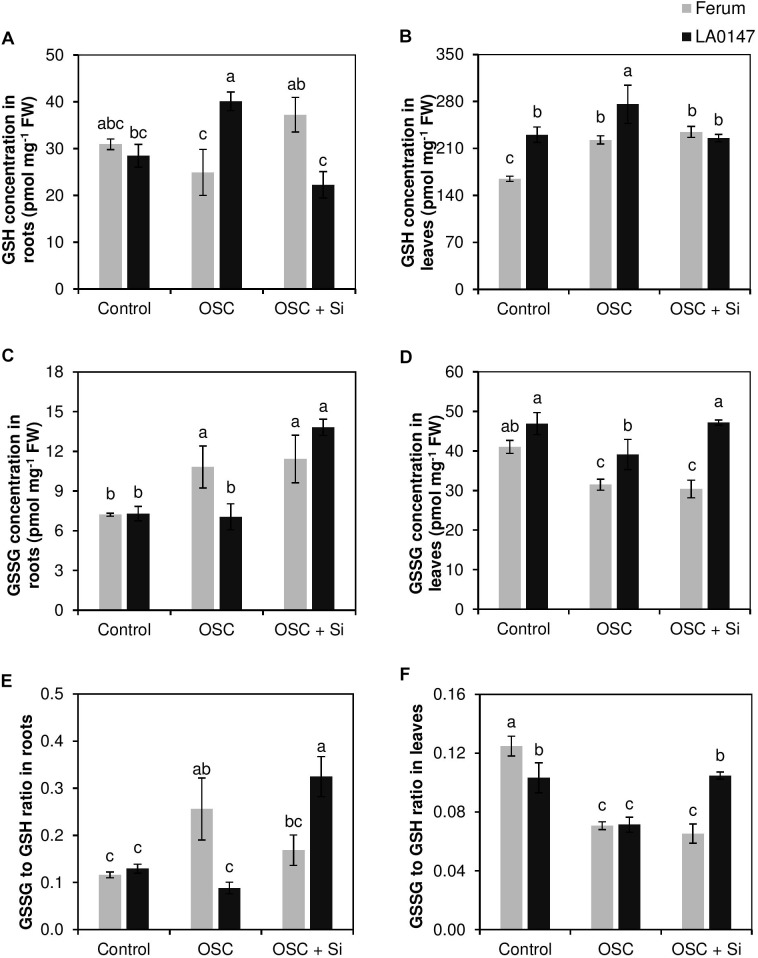
FIGURE 5.
Influence of Si supply on glutathione concentrations in roots and leaves of two contrasting tomato genotypes under osmotic stress. (A) GSH concentration in roots, (B) GSH concentration in leaves, (C) GSSG concentration in roots, (D) GSSG concentration in leaves (E) GSSG to GSH ratio in roots and (F) GSSG to GSH ratio in leaves. Plants were grown in hydroponic culture and osmotic stress was simulated by applying polyethylene glycol (PEG 6000). Si was provided at 0.75 mM for pre-cultured plants and at 1.5 mM for osmotic stressed plants. Roots and fully expanded leaves from 21-day old plants were harvested 7 days after imposition of osmotic stress. Bars indicate means ± SE. Different letters denote significant differences according to Fischer’s LSD test (p < 0.05; n = 4).

