Fig. 1.
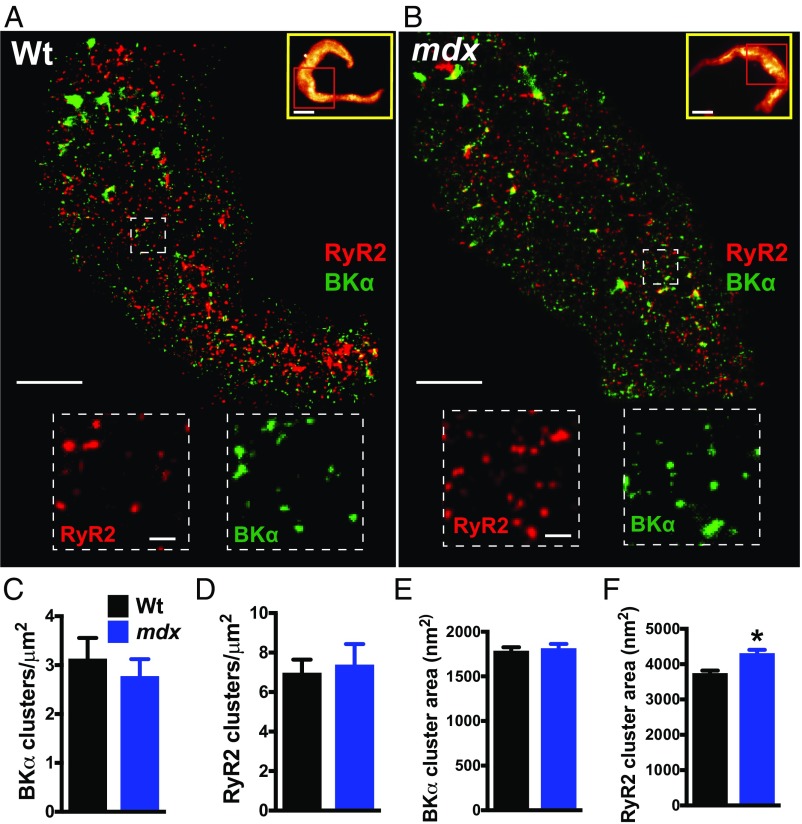
Superresolution analysis of RyR2s and BKα channels in native SMCs isolated from cerebral arteries. (A and B) Superresolution localization maps for RyR2 (red) and BKα (green) in native SMCs from wild-type (Wt) (A) and mdx (B) mice. (Scale bars, 3 µm.) Yellow box Insets show wide-field images of the entire SMC. Superresolution images were obtained for the regions within the red boxes. (Scale bars, 10 µm.) Dotted line Insets show magnified regions of interest. (Scale bars, 300 nm.) (C and D) The density of BKα (C) and RyR2 (D) clusters did not differ between groups (n = 10 cells per group, three animals per group). (E and F) The area of BKα clusters did not differ between groups (n = 5,390 to 5,960 clusters, 10 cells per group, three animals per group) (E), but RyR2 clusters in SMCs from mdx mice were larger than those in wild-type mice (F) (n = 3,251 to 3,560 clusters, 10 cells per group, three animals per group; *P < 0.05). All data are mean ± SEM.

