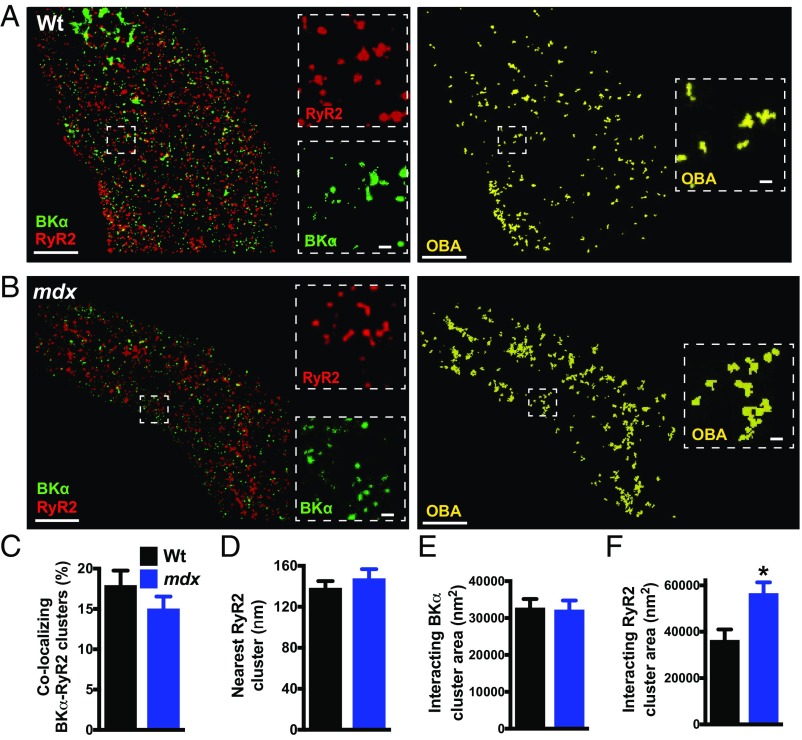
Fig. 2.
RyR2 clusters that colocalize with BK channels are larger than noncolocalizing clusters. (A and B) Object-based image analysis (OBA) was used to quantify colocalization of RyR2 (red) and BKα (green) protein clusters in SMCs from wild-type (A) and mdx (B) mice. RyR2 and BKα clusters that overlap at the GSDIM resolution limit are pseudocolored yellow. (Scale bars, 3 µm.) Insets (dotted lines) show magnified regions of interest. (Scale bars, 300 nm.) (C) OBA of the percentage of colocalizing RyR2 and BKα clusters (n = 10 cells per group, three animals per group). (D) Nearest-neighbor analysis showing the mean distance between each BKα cluster and its nearest RyR2 cluster (n = 10 cells per group, three animals per group). (E and F) Size analysis of colocalizing BKα clusters (E) (n = 759 to 778 clusters) and RyR2 clusters (F) (n = 789 to 933 clusters). The sizes of BKα clusters that colocalized with RyR2s did not differ between groups, but RyR2 clusters that interacted with BKα channels were larger in SMCs from mdx mice compared with those from wild-type mice (10 cells per group, three animals per group; *P < 0.05). All data are mean ± SEM.

