Fig. 3.
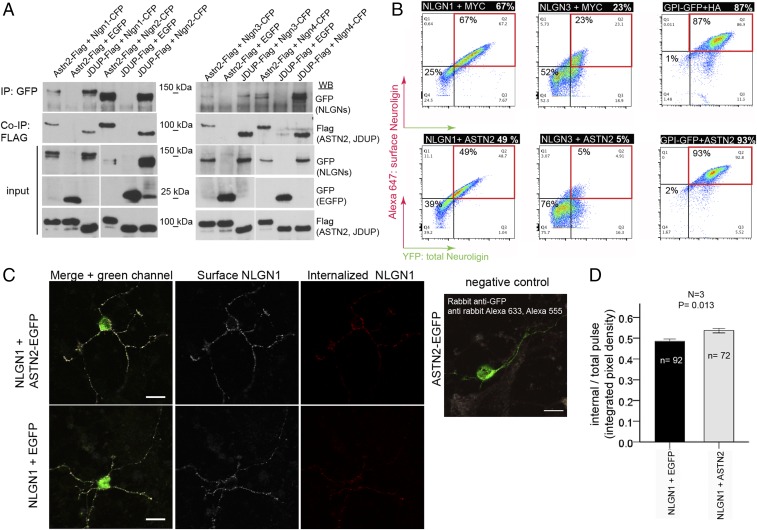
ASTN2 regulation of Neuroligin surface expression by protein–protein binding and endocytosis. (A) Western blots showing co-IP of ASTN2 and JDUP with Neuroligins (Nlgn) 1–4 in HEK 293T cells. (B) Live immunolabeling of surface Neuroligin (NLGN) expression (Alexa-647, red quadrants) in HEK 293T cells analyzed by flow cytometry in cells coexpressing NLGN1-HA-YFP or NLGN3-YFP with either a MYC control vector (Top) or ASTN2-HA (Bottom). (Right) Surface glycosylphosphatidylinositol (GPI)-anchored EGFP is unaltered by ASTN2. (C, Left) Pulse–chase labeling of NLGN1-HA-YFP coexpressed with either EGFP or ASTN2-EGFP in GCs showing surface (white) and internalized (red) NLGN1 labeling after a 20-min chase. (C, Right) Negative control, showing that the EGFP from ASTN2-EGFP (or EGFP) is not detected on the surface. (Scale bars: 10 μm.) (D) Quantification of the pulse–chase expressed as integrated pixel density (sum of all pixel intensities per area minus the background) of the internal labeling divided by the integrated pixel density of the total pulse (red + white). The graph shows mean ± 1 SEM. N, number of experiments; n, total number of cells analyzed. The P value was calculated by analysis of covariance (Methods). WB, Western blot.

