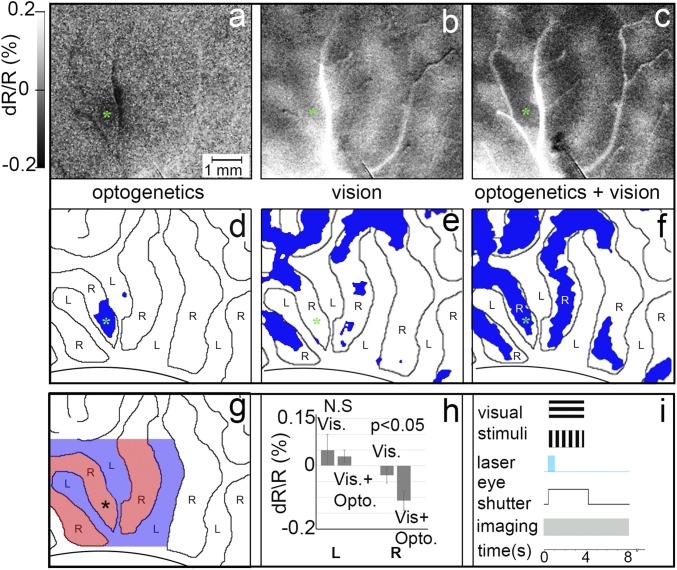
Fig. 3.
Optogenetic stimulation enhances eye-specific visual response. (A–C) Optical images in response to A optogenetic stimulation alone (32 mW/mm2 versus blank), (B) presentation of visual stimuli alone (left eye minus right eye), and (C) presentation of visual stimuli combined with optogenetic stimulation (left eye + laser versus right eye + laser). (Intensity scale bar applies to A–C.) From monkey B. (D–F) Significantly activated pixels (blue; P < 0.05) in A–C, with left-eye and right-eye OD columns outlined. (G and H) Quantification of peak reflectance change of all significant pixels near the optogenetic stimulation site (up to 3 OD columns away). (G) Colored region: area quantified. Blue, left-eye OD columns; red, right-eye OD columns. Asterisk: center of viral expression site and target of laser stimulation. (H) Reflectance change magnitude for same-eye (right-eye) and opposite-eye (left-eye) columns. Error bars are SD. For the opposite- (L) eye OD columns, there is no significant difference between vision alone vs. blank and vision+optogenetic stimulation vs. blank conditions. For the same (R) eye, optogenetic stimulation significantly enhances the response (t test, P < 0.05). Note: An increase in OI response magnitude is plotted as a negative reflectance change. (Scale bar in A applies to A–G.) (I) Timing of visual presentation, optogenetic laser stimulation, optical imaging, and control of eye shutters. N.S., not significant.

