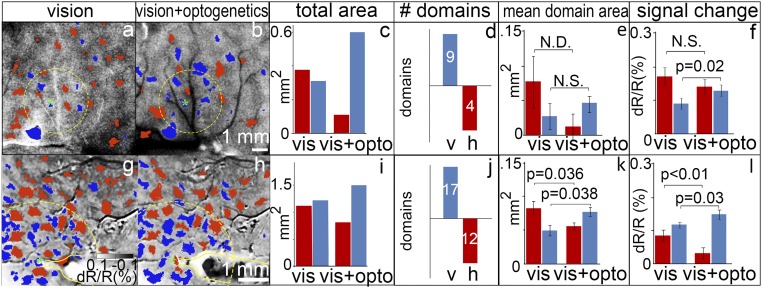
Fig. 4.
Optogenetic stimulation enhances visual responses in matched orientation domains. (A and B) Orientation subtraction maps (horizontal minus vertical) in the absence (A) and presence (B) of optogenetic stimulation (600 ms, 24 Hz, 64 mW/mm2) of a vertical domain (asterisks: center of opsin expression site and target of laser stimulation). Red pixels: significant horizontal activation; blue pixels: significant vertical activation (two-tailed t test). Same site of stimulation as in Fig. 3A from monkey B. (C) Quantification of red and blue pixels around (2-mm radius, indicated by yellow dotted circles) the transfection site in A and B shows optogenetic stimulation produces a shift toward greater vertical domain response (χ2 = 18.29, P < 0.001). (D) Number of domains (vertical, V, blue; horizontal, h, red) that increase (upward bar graphs) or decrease (downward bar graphs) in area. (E) Average area of each domain in mm2 (Wilcoxon signed-rank test; not significant due to the small number of domains). Error bars are SE. (F) Magnitude of the response from each domain (dR/R) (Wilcoxon signed-rank test, P < 0.05). Error bars are SE. (G–L) Similar results from monkey C. Yellow outlines in G and H indicate optical fiber position, targeting the blue domain. (Intensity scale bar in G applies to A, B, G, and H. Scale bar in B applies to A and B; scale bar in G applies to G and H.) N.S., not significant.; N.D., not enough data for statistical test. See images enlarged in SI Appendix, Fig. S5A.

