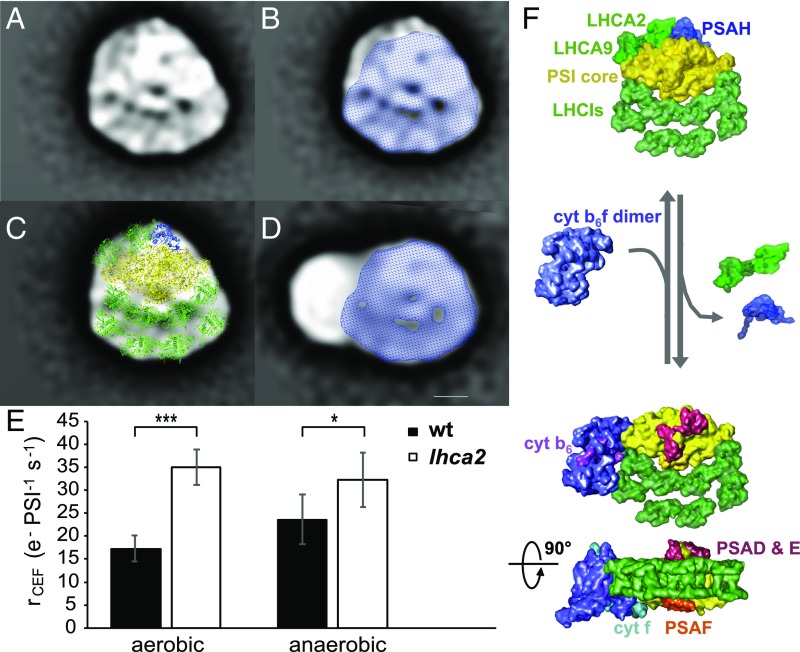
Fig. 5.
Dissociation of LHCA2 and LHCA9 from the PSI–LHCI complex favors the association of PSI–LHCI–cyt b6f supercomplexes and enhances cyclic electron flow. (A) Averaged TEM projection map of a PSI–LHCI complex with an additional density at its core. (B) Overlay of the PSI–LHCI complex from A with Fig. 4C. (C) Structural assignment of the PSI–LHCI complex from A based on fitting with the crystal structures of the PSI–LHCI complex (17). The additional densities compared with the smaller PSI–LHCI complex (B) were modeled with PSAH (blue) and two additional LHCA proteins (green) at the PSI core according to ref. 11. (D) Overlay of the CEF supercomplex projection map from Fig. 4A with the PSI–LHCI complex from Fig. 4C. (Scale bar: 5 nm.) (E) Cyclic electron transfer rates of a Δlhca2 mutant compared with wild-type levels in aerobic and anaerobic conditions. Rates were measured in steady state upon a transition from darkness to light with ∼130 μE m−2⋅s−1 light intensity. To exclude contribution of PSII to the electron transfer, cultures were treated with 40 μM DCMU. Anaerobic conditions were achieved by addition of 100 mM glucose and 2 mg⋅mL−1 glucose oxidase. To alleviate PSI acceptor side limitation upon transition to anaerobiosis, anaerobic samples were kept in the darkness for 40 min and continuously illuminated for 2 min before the rate measurements (n = 6 biological replicates ± SD). Statistical analysis: one-way ANOVA followed by a Tukey test for pairwise comparison of the means (***P < 0.001; *P < 0.05). (F) Structural model of CEF supercomplex formation upon dissociation of LHCA2, LHCA9, and PSAH from the PSI–LHCI complex. The PSI core is shown in yellow, LHCI proteins in bright green, cyt b6f in purple. Plastocyanin (cyt f in cyan, PSAF in orange) and ferredoxin (PSAD/E in red and cyt b6 in pink)-binding regions are indicated. All high-resolution components have been filtered to 20 Å to avoid overinterpretation.

