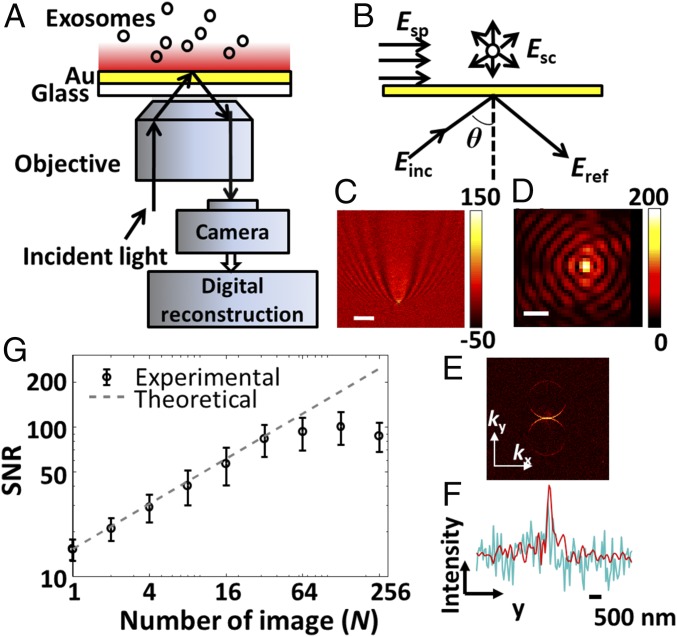
Fig. 1.
iPM system. (A) Schematic of iPM. (B) Interferometric scattering model of iPM. (C) Images of a 100-nm silica nanoparticle without (scale bar: 3 µm) and (D) with (scale bar: 300 nm) image-reconstruction process. (E) k-space image by taking 2D-FFT of C. (F) Longitudinal intensity profile across the particle in C (cyanine) and D (red). (G) SNR in iPM detection of 100-nm silica nanoparticles with the running-average algorithm, and the theoretical shot-noise limitation (dashed line).

