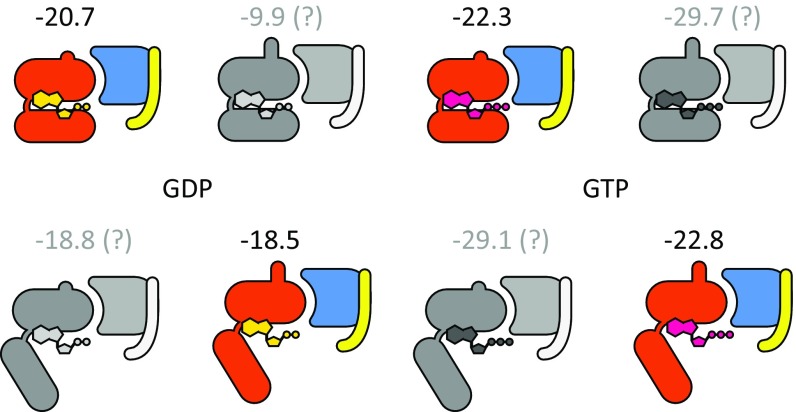
Fig. 6.
PDLD/S-LRA binding energies (in kilocalories per mole) of GDP and GTP to the Gα subunit in the different G-protein states. The colored states are based directly on X-ray structures whereas the grayscale states were modeled using different templates for each feature (the RS-AHD interdomain orientation and the α5 conformation). In the discussion we considered only the X-ray–based models. See SI Appendix, Fig. S1 for a match between the structures and the cartoons drawn here.

