Fig. 6.
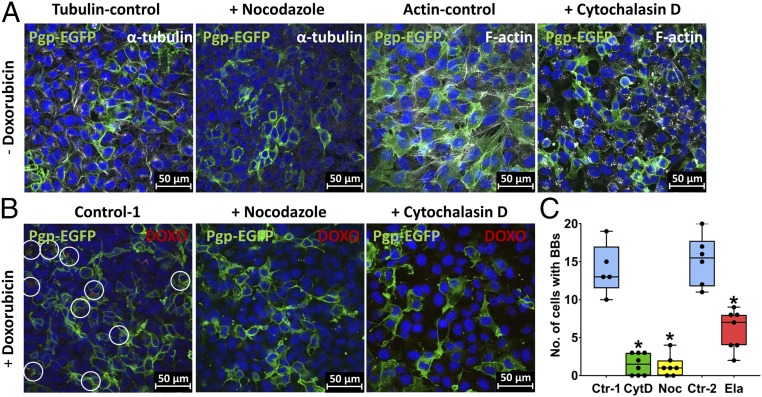
Pharmacological inhibition of barrier-body formation. Effect of cytoskeleton-disrupting agents (CytD, cytochalasin D; Noc, nocodazole) and of the Pgp inhibitor elacridar (Ela) on barrier-body formation was analyzed in hCMEC/D3 cocultures. (A) Noc- or CytD-treated cells were analyzed with confocal fluorescence microscopy following staining of α-tubulin (white) and F-actin (white) (Materials and Methods). DAPI was used as nuclear counterstain (blue), and Pgp-EGFP is visualized in green. Treatment of hCMEC/D3 cultures with Noc and CytD resulted in a depolymerization of microtubules and actin filaments, respectively. (B) Representative images of barrier-body formation (indicated by white circles) in DOXO-treated hCMEC/D3 cultures and after incubation with Noc or CytD (Materials and Methods). Cells were analyzed under a confocal laser scanning microscope, and barrier-body formation was compared between treatments. (C) Barrier bodies and cells were counted on five or more randomly captured confocal micrographs, and a total of 785–1,008 cells were counted per treatment (for total numbers of counted cells per treatment, see Materials and Methods). The graph shows the number of cells with barrier bodies (BBs) per counted cells in the absence of inhibitors (Ctr-1; 8.92% of the cells exhibited barrier bodies on average) and after Noc or CytD treatment. Additionally, the graph shows the number of cells with barrier bodies per counted cells after incubation of EFIG-AM–treated cultures with Ela (Materials and Methods) in comparison with cultures in absence of the inhibitor (Ctr-2; 9.03% of the cells exhibited barrier bodies on average). Data are shown as boxplots with whiskers from minimum to maximum values; the horizontal line in the boxes represents the median value. In addition, individual data are shown. *P < 0.0001.

