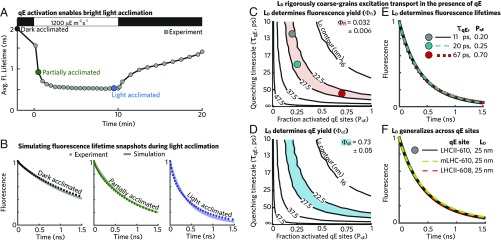
Fig. 2.
The excitation diffusion length defines transport in the presence of a homogeneous distribution of weak qE quenchers. (A) The average fluorescence lifetime when all RCs are closed of a wild-type A. thaliana leaf exposed to a dark–light–dark sequence (data from ref. 23). The black, dark-green, and blue dots represent the correspondingly colored fluorescence lifetime decays (dotted lines) in B. (B) Simulation (solid line) of fluorescence lifetime measurements (dotted lines) taken on leaves with all RCs closed in different states of acclimation to bright light. Black (Left) indicates leaves in the “dark-acclimated” state, dark green (Center) indicates the “partially acclimated” state, and blue indicates (Right) the “light-acclimated” state. The simulation lines use the following values for the timescale of quenching () and the fraction of activated qE sites (): , = 0; ps, = 0.1; and ps, = 0.45 for the dark-acclimated, partially acclimated, and light-acclimated curves, respectively. (C) Contour plot (black lines) of excitation diffusion length () as a function of and . The red area indicates a Chl fluorescence yield () of 0.032 , consistent with the best-fit Chl fluorescence lifetime for the light-acclimated state (blue line; B, Right). The colored circles correspond to the matched fluorescence lifetimes in E. (D) The contour plot (black lines) of excitation diffusion length () as a function of and . The cyan area indicates a fraction of excitation quenched by qE [qE yield ()] equal to 0.73 . (E) Three fluorescence lifetimes are plotted corresponding to () combinations with an excitation diffusion length of 25 nm—the matched points are shown in C. (F) Three fluorescence lifetimes are plotted corresponding to different sites of qE with combinations of () that give an excitation diffusion length of 25 nm. The black line corresponds to an LHCII-610 quenching site, which was used to generate simulation data for B–E. Simulation results using an mLHC-610 (dashed green line; ps, = 1) and LHCII-608 (dashed red line; ps, = 1) quenching site are also shown.

