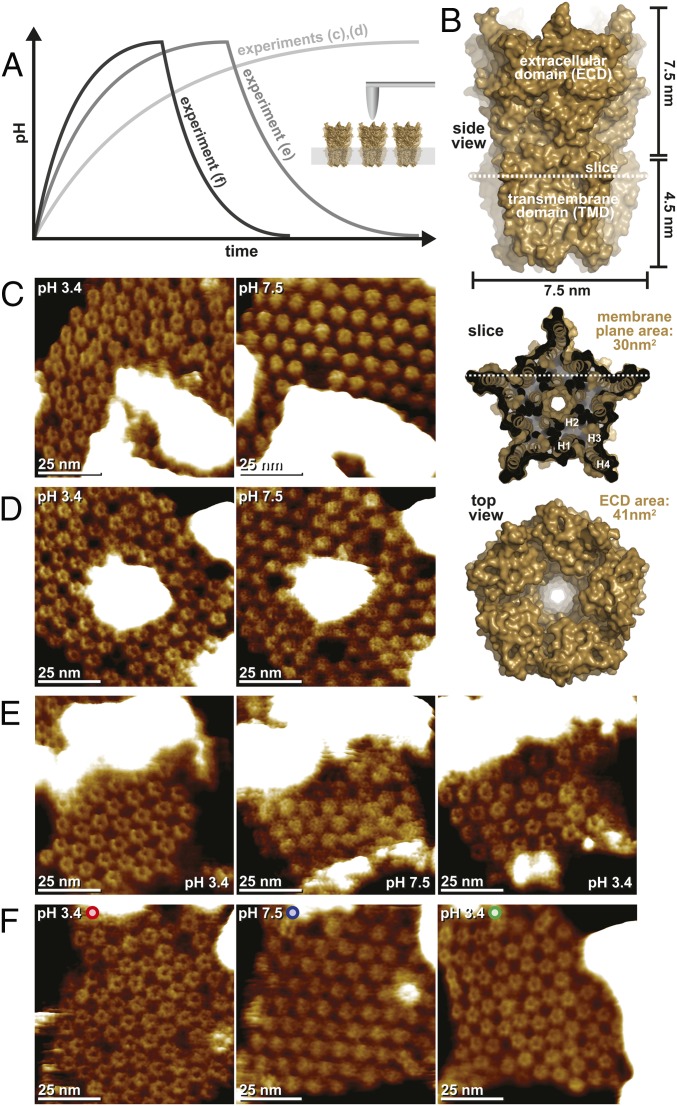
Fig. 1.
HS-AFM structural titration experiments with GLIC channels. (A) Schematic representation of the experimental procedure. (Inset) During HS-AFM imaging of membrane-embedded GLIC channels, the pH is gradually changed in the HS-AFM fluid chamber volume (150 μL) through a buffer exchange microfluidic device. The flow rate is adjusted to 5 μL⋅min−1 (experiments shown in C and D), 10 μL⋅min−1 (experiment shown in E), and 15 μL⋅min−1 (experiment shown in F). In the experiments shown in E and F, the pH was reversed to observe reversibility of assembly and structural changes. (B) Analysis of the GLIC architecture. A side view (Top), membrane slice close to the extracellular surface (Middle), and top view (Bottom) are shown. The dimensions of the molecule are indicated. High-resolution images (time averages over 5 s) of the initial pH 3.4 state (C and D, Left; open channel) and pH 7.5 state (C and D, Right; closed channel), as well as the reversed pH 3.4 state (E and F, Right; open channel) are shown.

