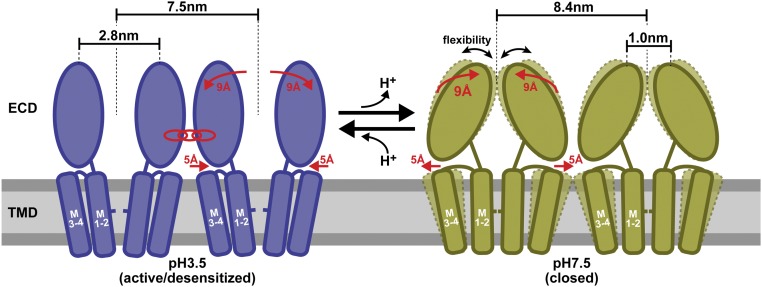
Fig. 4.
Schematic representation of pH-dependent conformational changes in GLIC channels. At acidic pH in the activated/desensitized state (blue), the ECDs exhibit a 2.8-nm top-ring diameter and the channels engage in specific intermolecular interactions, while at physiological pH in the closed state (green), the ECDs collapse toward the channel fivefold axis and exhibit increased conformational flexibility. This transition is associated with an increase in the overall diameter of the pentamer by about 1 nm (from 7.5 to 8.4 nm), which concerns either the bottom part of the ECDs or the top part of the TMDs as schematically represented. The membrane plane is schematized by a horizontal rectangle (gray). The transient occurrence of asymmetric conformations between these two major states is evidenced.

