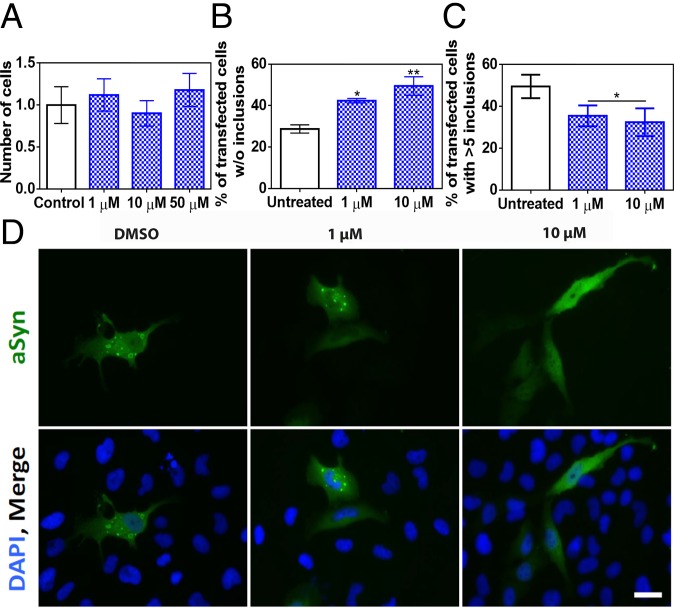
Fig. 4.
Inhibition of α-Syn aggregate formation in cultured cells. (A) Human neuroglioma cell (H4) survival when incubated with different concentrations of compound (blue) and without (white) the compound. (B and C) Reduction of α-Syn inclusion formation in human cultured cells in the presence of different concentrations of SC-D. (B) Percentage of transfected cells devoid of α-Syn aggregates. (C) Percentage of transfected cells bearing >5 α-Syn aggregates. (D) Representative epifluorescent images from cells treated with SC-D. n = 3. (Scale bar, 30 μm.) Error bars are represented as SE of means; *P < 0.05 and **P < 0.01.

