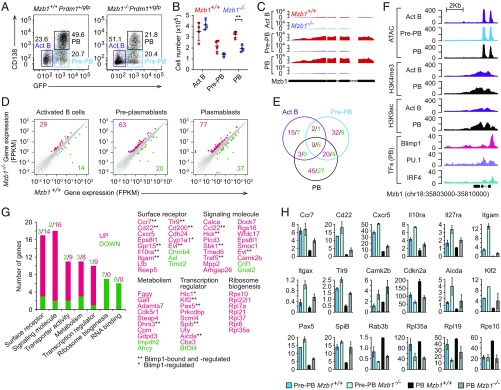
Fig. 3.
Changes in the transcriptome of Mzb1−/− PBs. Flow cytometry to detect frequencies (A) and mean (±SD) numbers (B) of CD138−Blimp-GFP− activated B cells (Act B), CD138−Blimp-GFP+ Pre-PB, and CD138+Blimp-GFP+ PB at 4 d after LPS stimulation of Mzb1+/+Prdm1+/gfp and Mzb1−/−Prdm1+/gfp B220+ splenocytes. Data are representative of three experiments; n = 4. **P < 0.01. (C) RNA-Seq reads of Mzb1 transcripts from Mzb1+/+ (red) and Mzb1−/− (blue) Act B, Pre-PB, and PB. (D) Scatter plot of gene-expression levels in Mzb1+/+ (x axis) and Mzb1−/− (y axis) Act B cells (Left), Pre-PB (Center), PB (Right). The unaltered (gray), up- (red), and down-(green) regulated genes are highlighted. (E) Overlap of differentially expressed genes in Act B cells, Pre-PB, and PB. Numbers of up- (red) and down- (green) regulated genes in Mzb1−/− relative to Mzb1+/+ are shown. (F) Tn5 transposase accessible (ATAC-Seq) regions, H3K4me3, and H3K9ac marks, on the Mzb1 locus in Act B cells (purple), Pre-PB (blue), and PB (black). The occupancy of IRF4, PU.1, and Blimp1 on the Mzb1 locus in PB cells, is shown (Bottom). Data source, NCBI GEO accession no. GSE71698. (G) Functional classification of up- (red) and down- (green) regulated genes in Mzb1−/− PB. Numbers above the bars indicate number of genes associated with each functional class. Selected genes from functional classes are indicated (Right). (H) Levels (fragments per kilobase of transcript per million mapped reads) of differentially expressed key genes in Mzb1+/+ and Mzb1−/− Pre-PB and PB. Error bars show SD; n = 2.

