Fig. 4.
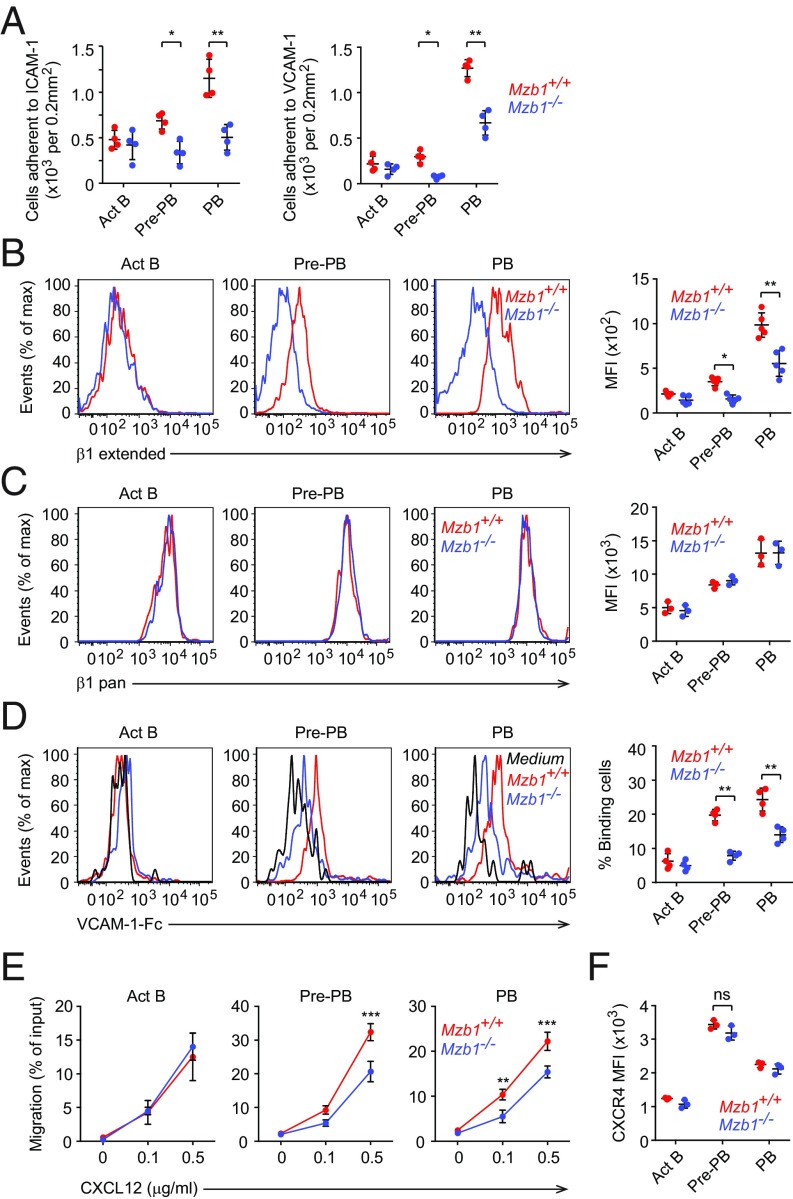
Mzb1−/− ASCs show impaired β1 integrin activation and migration. (A) Adhesion of Act B, Pre-PB, and PB cells to slides coated with ICAM-1 (Left) or VCAM-1 (Right). (B and C) Representative histograms and quantification (mean fluorescent intensity, MFI) of extended β1-integrin (B) and total β1-integrin (β1 pan) in Act B, Pre-PB, and PB cells. Data are representative of three experiments; n = 3. (D) Representative histograms showing the adhesion of Act B, pre-PB and PB cells to soluble VCAM-1, and quantification of the frequency of the binding cells. (E) Transwell assay to assess the migration of Act B, Pre-PB, and PB cells toward CXCL12 (0, 0.1 and 0.5 μg/mL) on VCAM-1–coated plates. (F) Quantification (MFI) of CXCR4 cell surface expression in the corresponding cells. ns, nonsignificant. Data are representative of three independent experiments. n = 3. *P < 0.05, **P < 0.01, ***P < 0.001.

