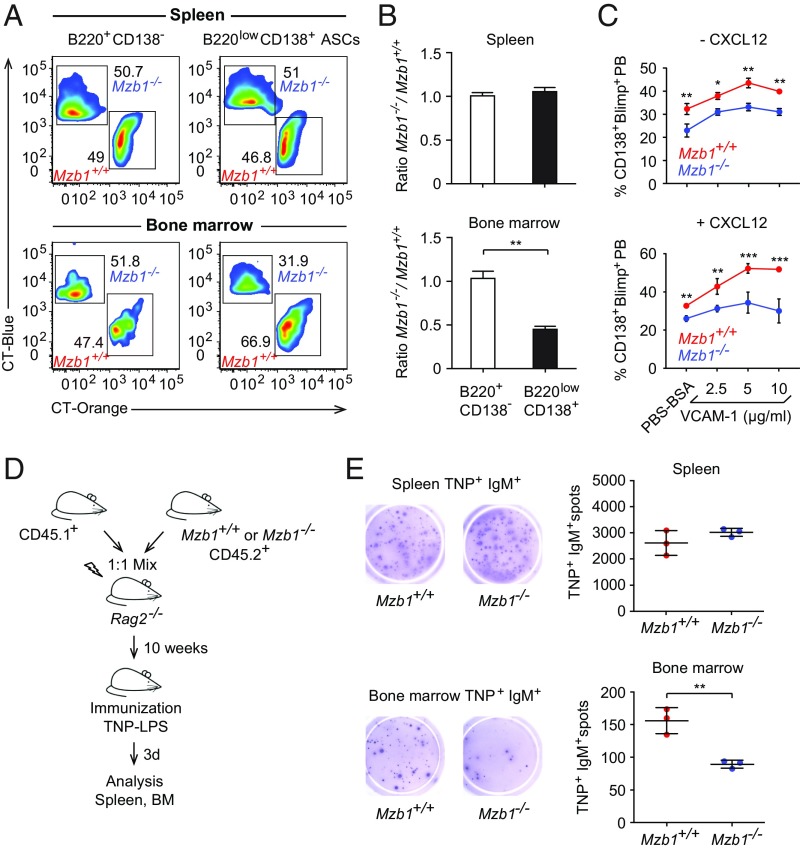
Fig. 6.
(A) Flow cytometric analysis to detect CT orange-labeled Mzb1+/+ B220lowCD138+ ASCs and CT blue-labeled Mzb1−/− ASCs from TNP-LPS-immunized mice that have been sorted, labeled, and transferred in a 1:1 ratio into recipient mice 20 h before flow cytometric analysis. B220+CD138− cells served as a control. Numbers represent cell frequencies. (B) Ratios (±SD) between Mzb1−/− and Mzb1+/+ B220lowCD138+ ASCs that migrated to the spleen and BM. Data represent two independent experiments; n = 3. (C) Frequencies of CD138+Blimp-GFP+ PBs in cultures of LPS-stimulated B220 splenocytes of Mzb1+/+Prdm1+/gfp and Mzb1−/−Prdm1+/gfp mice on VCAM-1–coated plates, in the absence (Upper) or presence (Lower) of CXCL12. Frequencies of CD138+Blimp-GFP+ PBs (±SD) from three different experiments are shown. n = 3. *P < 0.05, **P < 0.01, ***P < 0.001. (D) Schematic representation of mixed BM chimeras. BM from either CD45.2+ Mzb1+/+ or CD45.2+ Mzb1−/− were mixed 1:1 with BM from CD45.1+ mice and transferred into irradiated Rag2−/− mice. Ten weeks after transfer, the recipient mice were immunized with TNP-LPS, and analyzed 3 d after. (E) Representative ELISpot (Left) and mean (±SD) numbers (Right) of TNP+IgM+ ASCs in spleen (Upper) and BM (Lower) 3 dpi of the mixed BM chimeras; n = 4. Data are representative of two different experiments with three to six mice per group and experiment. **P < 0.01.

