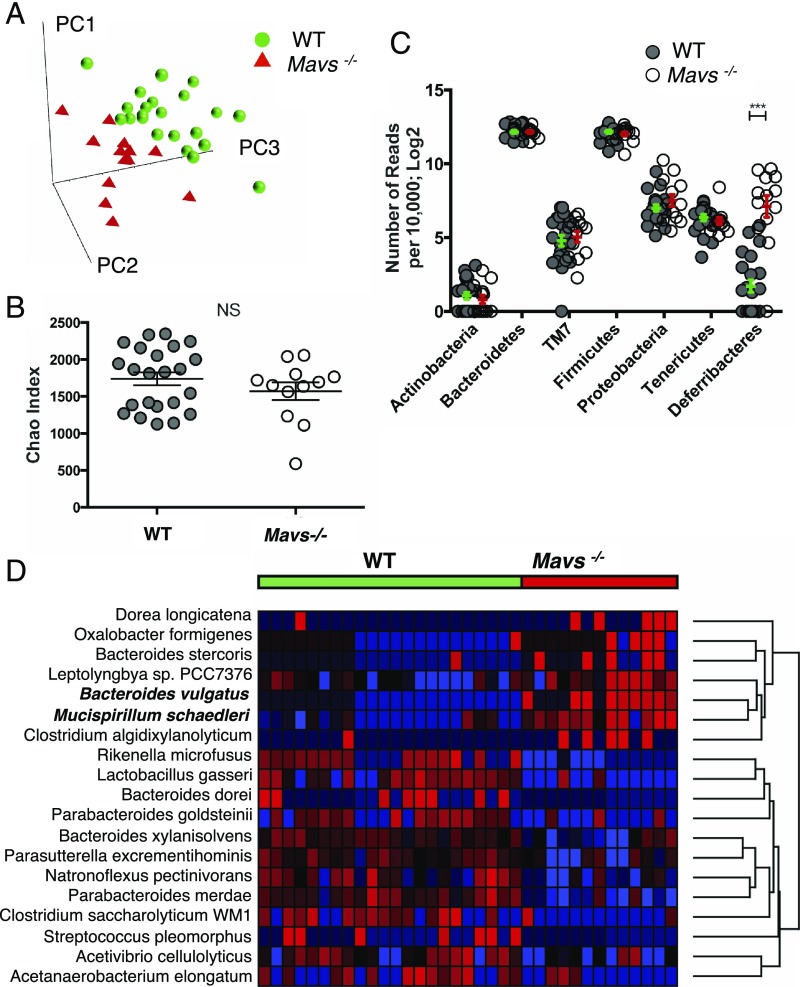
Fig. 1.
Single-housed Mavs−/− and WT (B6J and Mavs+/+ litt) mice exhibit significant differences in gut microbial composition. (A) PCA of gut microbiota of Mavs−/− and WT mice. Species-level data were used to construct PCA plots. Data from two independent experiments are shown (SI Appendix, Fig. S1). PC1, PC2, PC3, principal components 1, 2, and 3, respectively. (B) Chao’s index of species richness in the feces samples of Mavs−/− and WT mice. Before the analysis sequences were clustered into OTUs with 97% similarity. Means ± SDs are shown. (C) Phylum-level analysis of the gut microbiota of Mavs−/− (open dots) and WT (gray dots) mice. Data are normalized to 10 000 reads per sample and are log2 transformed. The y axis represents the number of reads. Means ± SEMs are shown. (D) Heatmap visualization of the results of the species-level comparison of gut microbiota of Mavs−/− and WT mice. Significance was determined by Student’s t test and adjusted for multiple comparisons using the q-value method. Species with q < 0.05 were selected. Highly significant species (unadjusted P < 10−6) are labeled with bold font. ***P < 0.001; NS, not significant as determined by Student’s t test.

