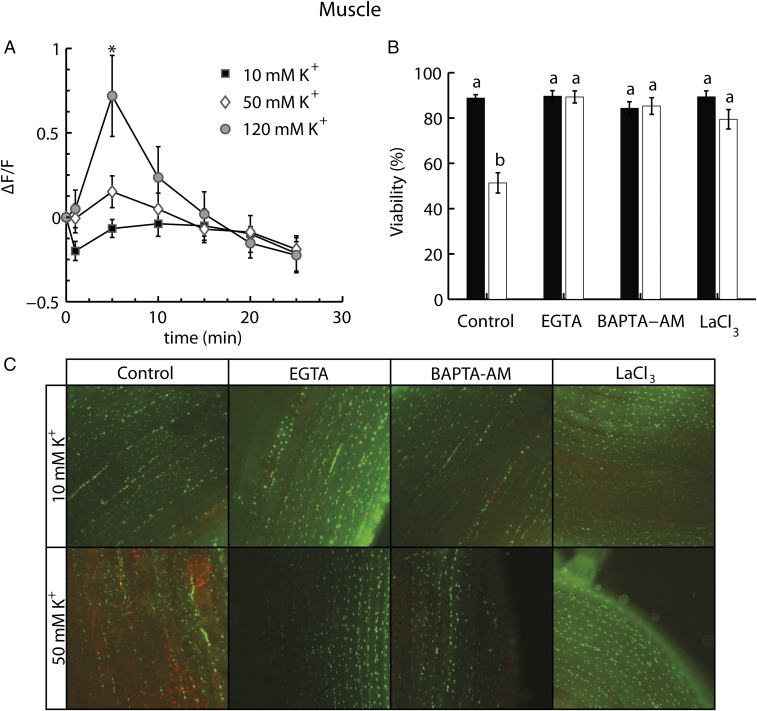
Fig. 4.
The role of Ca2+ in depolarization-induced cell damage. (A) Ca2+ fluorescence in fibers over time exposed to 10, 50, or 120 mM K+. (B) In vitro muscle fiber viability after 24 h at 0 °C using 10- or 50-mM extracellular K+ buffers. Experiments were run in control buffer and in conjunction with the addition of EGTA (an extracellular Ca2+ chelator), BAPTA-AM (an intracellular Ca2+ chelator), or LaCl3 (a Ca2+ channel blocker). Data are expressed as mean ± SEM; dissimilar letters indicate treatment groups that differ statistically (two-way ANOVA, Tukey’s multiple-comparisons test, P < 0.05). The asterisk indicates a significant increase in fluorescence relative to the other groups (two-way repeated-measures ANOVA, Tukey’s multiple-comparisons test, P < 0.05). For average viabilities: n = ≥9 animals for each treatment. For average Ca2+ fluorescence: n = ≥4 fibers from two or more animals. (C) Examples of composite pictures representing each treatment group (live cells are green, stained with SYBR 14, and dead cells are red, stained with PI). Each image is 750 pixels across, which corresponds to roughly 1 mm.

