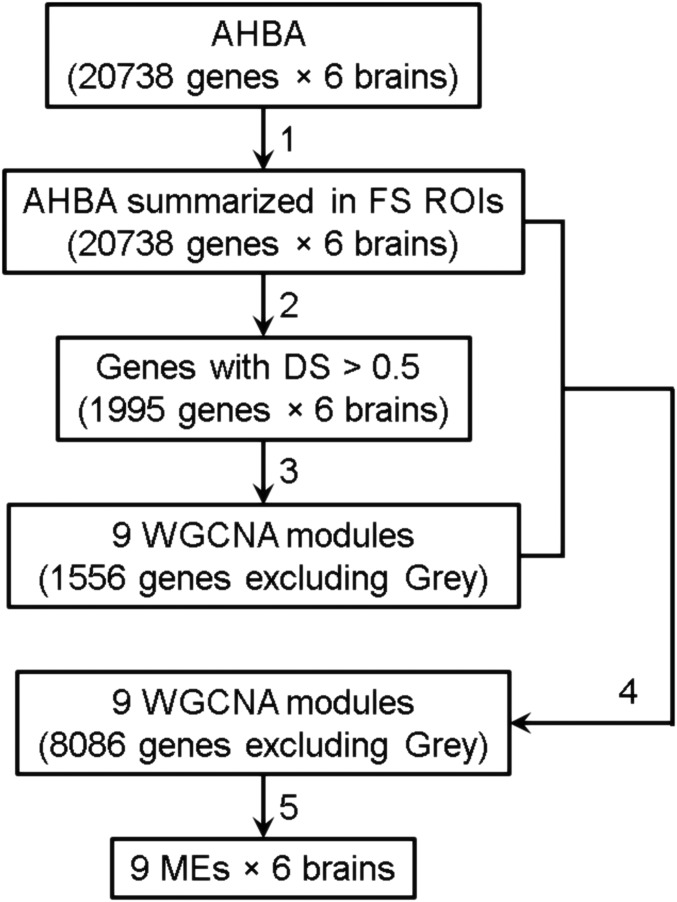
Fig. 1.
Flowchart of the WGCNA analysis. Step 1: Gene expression profiles of six AHBA datasets (each with 20,738 genes) are summarized in FreeSurfer (FS) ROIs. Step 2: DS (4) of each gene expression profile across six AHBA datasets is calculated, resulting in 1,995 genes with DS > 0.5. Step 3: Genes with DS > 0.5 are used as input to the WGCNA analysis, which generated eight consensus networks, i.e., modules containing 1,556 genes. All other genes are assigned to the Gray module. Step 4: Expression profiles of 20,738 genes are correlated with the eight MEs and genes with a correlation coefficient bigger than 0.5 are assigned to the corresponding module. This resulted in 8,086 assigned genes. Step 5: MEs of the nine new modules are calculated.

