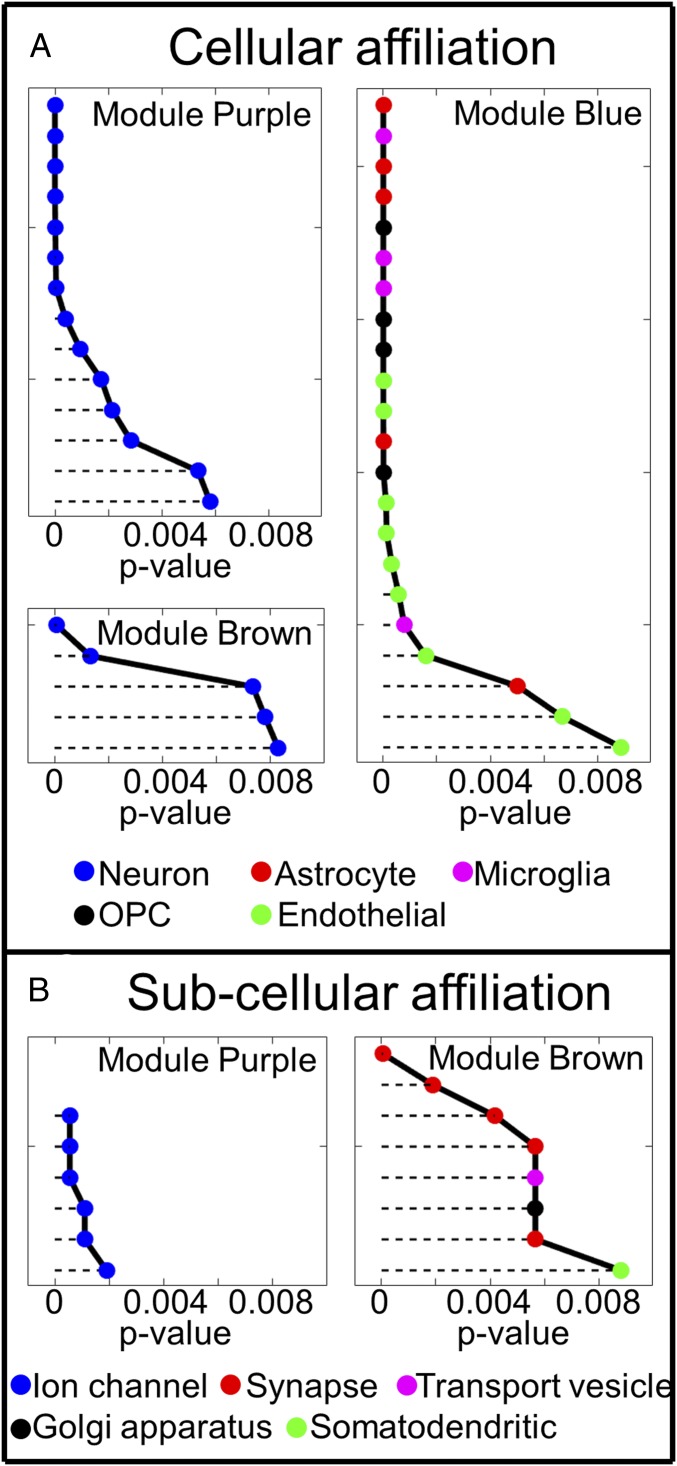
Fig. 3.
Analysis of cellular (A) and subcellular (B) gene affiliation using ToppGene. Each point in this figure represents a predefined cluster of genes that have different cellular (Coexpression Atlas in ToppGene) and subcellular (GO Cellular Component in ToppGene) affiliation in ToppGene. Different clusters associated with different cell types are marked by different colors, as shown at the bottom. Detailed cluster names are listed in Dataset S2. Results show that genes in modules Purple and Brown are affiliated with different parts of the neuron (voltage-gated ion channels in Purple, and mostly synapsis in Brown), while genes in the Blue module are mostly affiliated with glial (astrocytes, microglia, and OPCs) and endothelial cells. All P values were adjusted for multiple comparison using the FDR method with the Benjamini–Hochberg procedure. Only those clusters with P < 0.01 are shown in the figure. Lower P values correspond to higher gene enrichment profiles.

