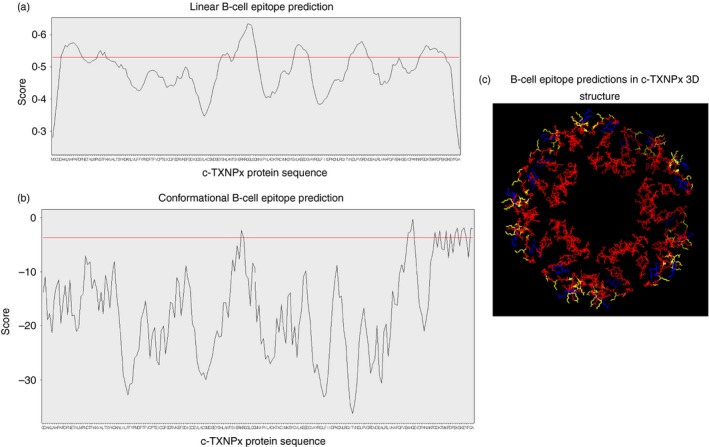
Figure 2.

B‐cell epitope prediction within cytosolic tryparedoxin peroxidase (c‐TXNPx) protein sequence. (a) BepiPred linear B‐cell epitope prediction. The x‐axis shows the amino acid position in c‐TXNPx sequence, and the y‐axis shows the score value for each residue. The horizontal red line indicates the threshold score value of 0·53, from which positive epitopes are considered. (b) DiscoTope conformational B‐cell epitope prediction. The x‐axis shows the amino acid position in c‐TXNPx sequence, and the y‐axis shows the score value for each residue. The horizontal red line indicates the threshold value of −3·7 (default setting), from which positive epitopes are considered. (c) Graphical three‐dimensional representation of predicted epitopes within c‐TXNPx structure. Linear (red) and conformational (blue) epitopes and regions of overlapping (yellow) are specified.
