
Figure 4.
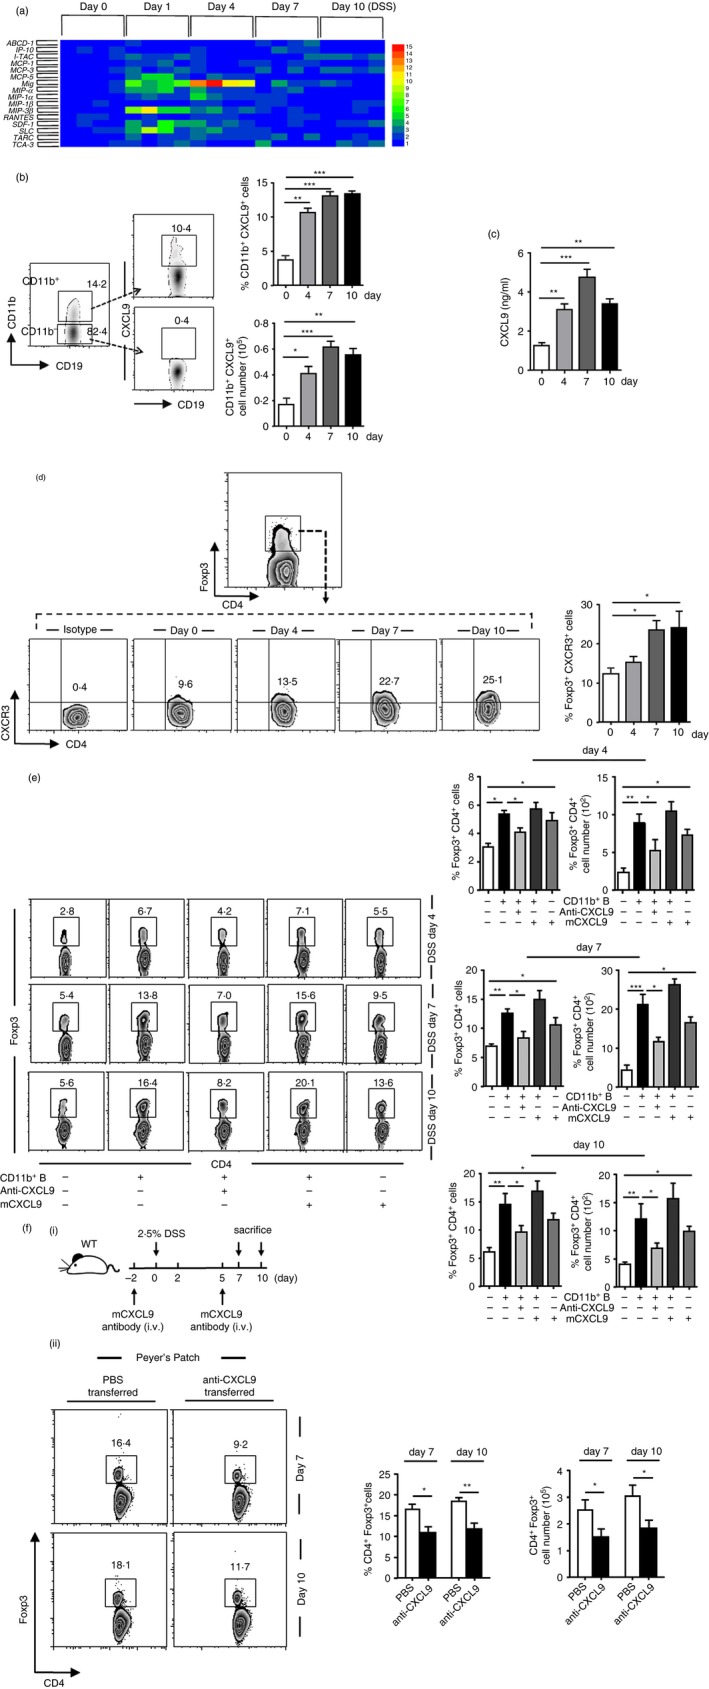
The induced CD11b+ B cells initially produce CXCL9 to increase regulatory T (Treg) cells. (a) Real‐time PCR analysis was performed to examine the chemokine expressions of Peyer's patches (PPs) CD11b+ B cells purified from dextran sulphate sodium (DSS) ‐treated mice. The chemokine profile was developed using the hemi software. Samples of every phage in colitis contain four mice. (b) CXCL9+ expression within the CD11b+ or CD11b−‐gated population was obtained in PPs on days 0, 4, 7 and 10 after colitis induction. (c) PP‐derived CD11b+ B cells from mice with colitis were sorted and cultured in complete RPMI‐1640 for 24 hr. The cell supernatant was harvested, and the level of chemokine CXCL9 was determined by enzyme‐linked immunosorbent assay. (d) CXCR3 expressions gated on Foxp3+ T cells from PPs during the process of colitis were detected using flow cytometry. (e) Total PP‐derived lymphocyte suspension (described as in Fig. 3b, 2 × 10⁶ cells/well) was either cultured alone or with CXCL9 (50 ng/ml), CD11b+ B‐cell supernatant (described as in Fig. 3b) CD11b+ B cells supernatant and CXCL9 or CD11b+ B‐cell supernatant and anti‐CXCL9 antibody (1 μg/ml), which were separated in a 24‐well Transwell plate for 4 hr. Percentage and absolute number of Treg cells were determined by FACS. (f; i) Illustration of the protocol of anti‐CXCL9 antibody (4·5 μg/g) administration in DSS‐induced mice. (f; ii) Frequencies and absolute numbers of PP‐derived Treg cells on days 7 and 10 after CXCL9 neutralization were analysed by flow cytometry. *P < 0·05; *P < 0·05; **P < 0·01. Results presented as the mean ± SEM of one experiment, which was repeated at least three times yielding similar results.