-
A
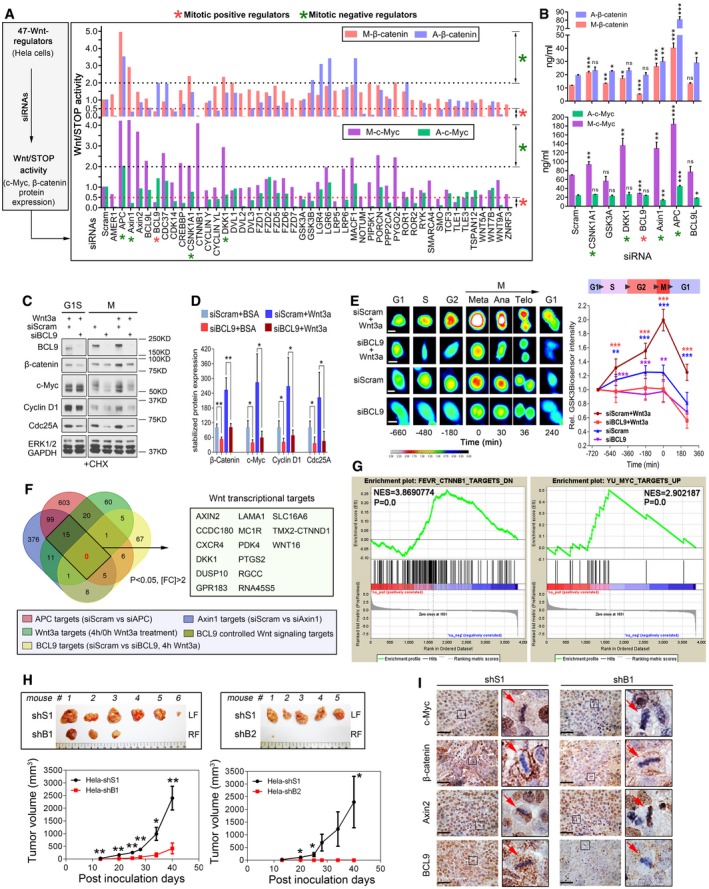
Normalised Wnt/STOP signalling activity by quantification of the protein expression of two Wnt/STOP target proteins, β‐catenin and c‐Myc, in mitotic (M) and asynchronised cells (A) after silencing 47 Wnt signalling regulators.
-
B
ELISA validation of selected Wnt/STOP signalling regulators (n = 3).
-
C, D
(C) Immunoblotting and (D) quantification of the stability of four STOP target proteins in both G1S and natural mitotic cells treated with BCL9 siGenome pools and CHX (n = 3).
-
E
Representative pictures (left panel) and the normalised biosensor intensity based on live‐cell imaging of the cells with a GSK3‐GFP biosensor following different treatments before and after metaphase (n = 10). Scale bars represent 10 μm.
-
F
Venn diagram analysis of the number of Axin1, APC, and Wnt3a signalling and/or BCL9‐regulated transcriptional targets.
-
G
Myc and β‐catenin target gene enrichment analysis based on the transcriptome targets regulated by BCL9.
-
H
The representative xenograft tumours (top panel) and tumour growth analysis (bottom panel) of scramble and BCL9 stable knockdown cells. LF: left flank of mouse, RF: right flank. n = 6 for shS1 vs. shB1, n = 5 for shS1 vs. shB2.
-
I
Immunohistochemical staining of the xenograft; the red arrows indicate the representative mitotic cells. Scale bars represent 200 μm.
< 0.001. All data are the mean
SD. See also Fig
.

