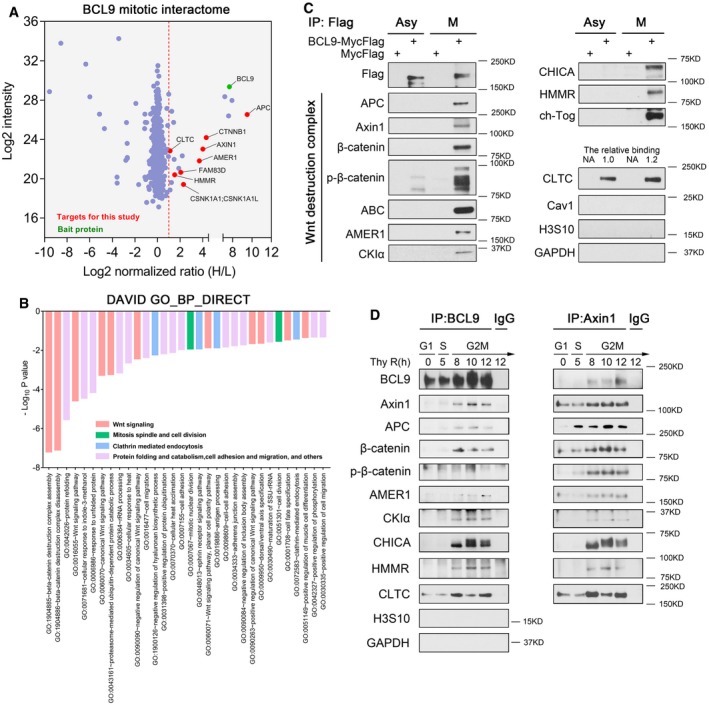
Figure 3. Dissecting the mitotic interactome of BCL9.

- Volcano plot of the BCL9 mitotic interactome by the SILAC proteomics approach. Red dashed line indicates a strict cut off by a normalised SILAC H/L ratio > 2.
- DAVID functional annotation analysis of enriched biological process (BP) by the potential mitotic BCL9 interactome (normalised SILAC H/L ratio > 1.5).
- An independent immunoprecipitation assay for validation of potential BCL9 interactors in both asynchronised and mitotic cells. The relative binding of CLTC with BCL9 is quantified and labelled on top of the CLTC blot.
- Immunoprecipitation assay of the endogenous BCL9 and Axin1 interaction in synchronised HeLa cells, from G1S to G2M. P‐H3S10, a mitotic marker indicating mitosis.
