-
A, B
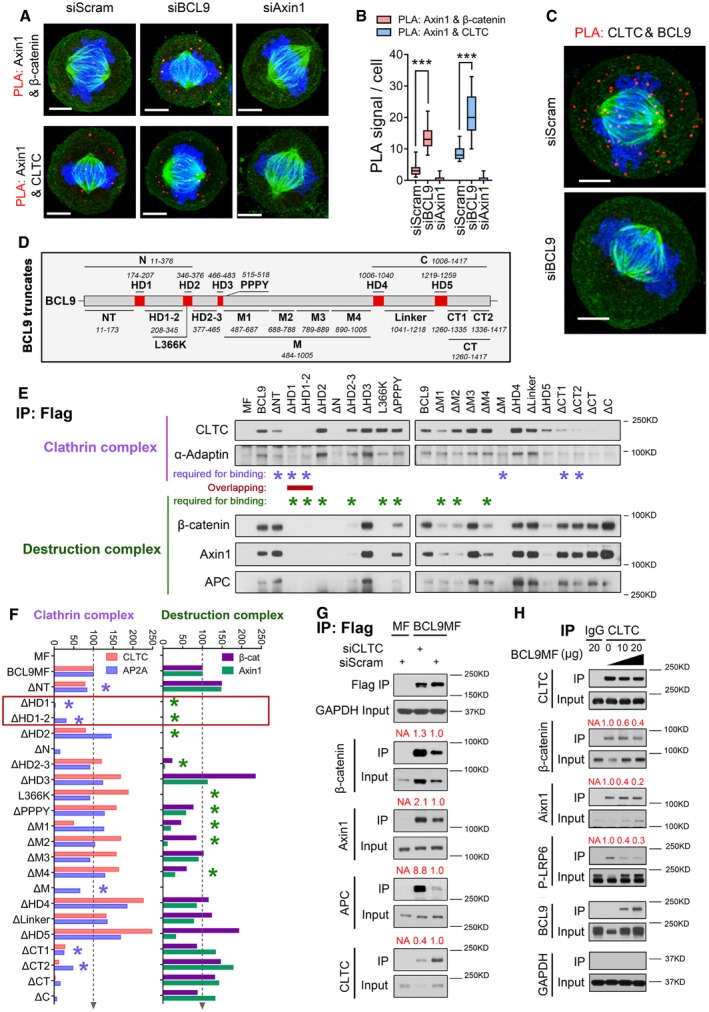
Duolink analysis (A) and its quantification (B) of the interaction by assessing the PLA complex in mitotic cells after BCL9 or Axin1 knockdown (n = 20). Scale bars represent 5 μm. Significance was measured by two‐tailed unpaired t‐test, ***P < 0.001, the horizontal lines in boxplot indicate the medium reading of the data, box ranges from Min to Max, all data are the mean ± SD.
-
C
Duolink analysis of the interaction of BCL9 and CLTC in mitotic cells. Scale bars represent 5 μm.
-
D
Schematic diagram of 20 truncated BCL9 forms designed for subsequent immunoprecipitation analysis.
-
E
Immunoprecipitation analysis of the interaction of truncated BCL9 forms in mitosis; the purple stars indicate the domain required for clathrin complex binding, and the green stars indicate the domains for β‐catenin complex binding. The domain required for both clathrin and β‐catenin complexes binding is indicated by a red line.
-
F
Quantification of the relative binding of the truncated forms with the clathrin complex or β‐catenin complex; the red frame indicates the common domains of BCL9 for binding of both complexes.
-
G
Immunoprecipitation analysis of the BCL9‐MF interaction in CLTC‐knockdown mitotic cells.
-
H
Immunoprecipitation analysis of the endogenous clathrin interaction with LRP6 signalosome components in BCL9 MF‐overexpressing mitotic cells.
.

