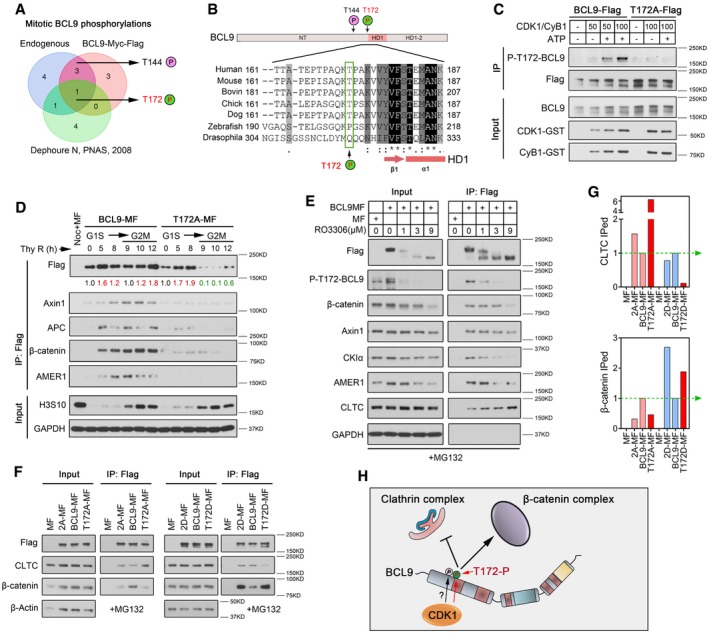
Figure 6. CDK1‐driven T172 phosphorylation stabilises BCL9 and regulates its interaction with clathrin.

- Venn diagram analysis of BCL9 mitotic phosphorylation sites in HeLa cells by mass spectrometry.
- Schematic diagram of the position of two phosphorylation sites on the BCL9 N‐terminal domain, and protein alignment analysis of the sequence around T172 in different species from http://www.uniprot.org.
- In vitro CDK1/cyclin B1 kinase assay for immunoprecipitation‐purified BCL9‐Flag or T172A‐Flag proteins.
- Immunoprecipitation analysis of transiently expressed BCL9‐MF or T172A‐MF interactors in synchronised cells, from G1S to G2M phase. The relative level of BCL9‐MF or T172A‐MF immunoprecipitation is determined; red numbers indicate up‐regulation; and green numbers indicate down‐regulation compared to the starting time point.
- Immunoprecipitation analysis of the transiently expressed BCL9‐MF interaction in mitotic cells treated with RO3306.
- Immunoprecipitation analysis of the interaction of the T172 inactive mutant T172A, the activation mutant T172D, and the double inactive mutant T172/T144 (2A) or activation mutant (2D) transiently expressed in mitotic cells.
- Quantification for the inactive or activation mutant interactions indicated in Fig 6F. The wild‐type BCL9 interaction is normalised to 1, indicated by a green dashed line with an arrow.
- A schematic diagram of BCL9 phosphorylation regulation of its interactions.
