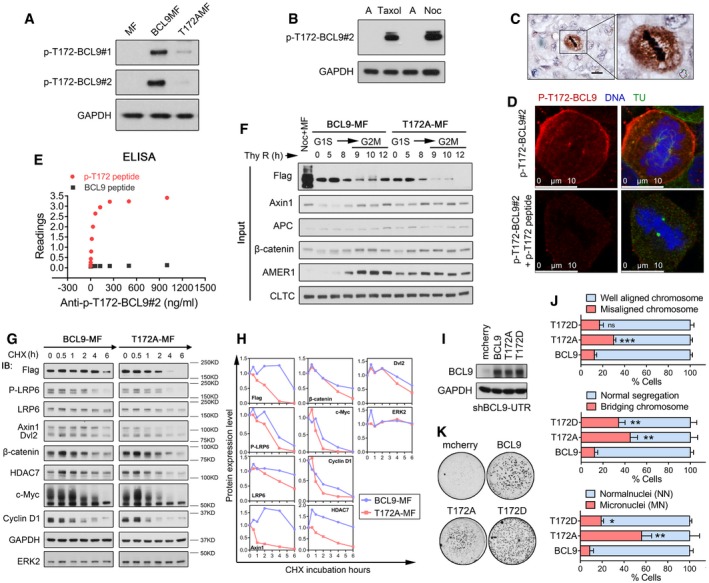
Figure EV6. CDK1‐driven BCL9 phosphorylation at T172 regulates BCL9 interaction with clathrin in mitosis (related to Fig 6).

- Immunoblotting analysis of BCL9 T172 phosphorylation in mitotic cells with BCL9MF or T172AMF expression by two anti‐P‐T172‐BCL9 rabbit polyclonal antibodies.
- Immunoblotting analysis of endogenous BCL9 T172 phosphorylation in mitotic cells by a selected anti‐P‐T172‐BCL9 rabbit polyclonal antibody.
- Immunohistochemical staining of P‐T172‐BCL9 in a human HCC tissue. Scale bars represent 50 μm.
- Immunofluorescence analysis of P‐T172‐BCL9 subcellular localisation in mitotic cells treated with or without P‐T172 peptide blocking. Scale bars represent 10 μm.
- ELISA analysis to confirm anti‐P‐T172‐BCL9 antibody recognising T172 phosphorylation peptide specifically.
- Immunoblotting analysis of the input for Fig 6D.
- CHX chase analysis of the stability of overexpressed or endogenous proteins in mitotic cells with BCL9 stable knockdown by shBCL9‐UTR.
- Quantification of protein stability in the CHX chase assay mentioned above.
- Immunoblotting analysis of the BCL9 and its mutants expression in shBCL9‐UTR knockdown cells.
- Live‐cell imaging analysis of cell division problem by stable expression of BCL9, T172A or T172D. Twenty‐three H2BGFP‐mitotic stable cells were monitored for each time experiment; data are shown from three independent experiments. Significance was measured by two‐tailed unpaired t‐test, *P < 0.05, **P < 0.01, ***P < 0.001. All data are the mean ± SD.
- Oncogenic soft agar colony formation assay of cells stably expressing BCL9, T172A or T172D.
Source data are available online for this figure.
