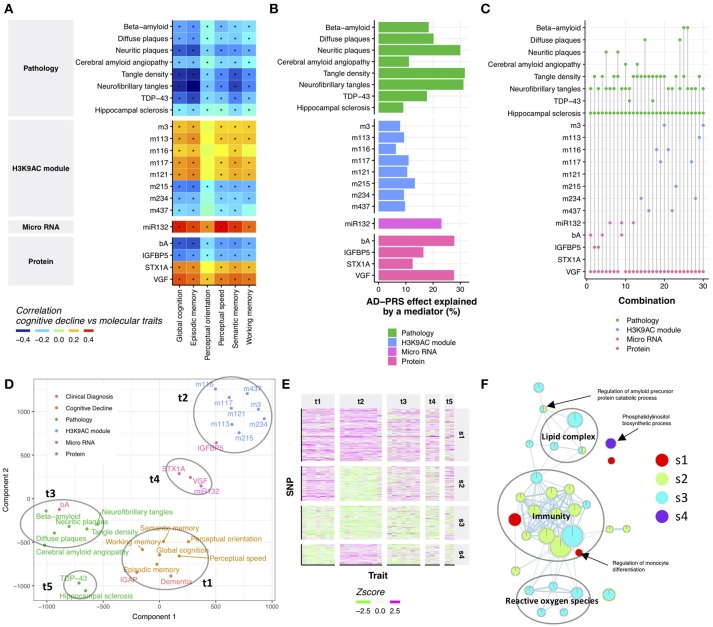
Figure 2.
Neuropathological and molecular traits mediating AD-PRS (A). Correlation between cognitive decline and AD-PRS-associated neuropathologies and molecular signatures. An asterisk indicates Bonferroni-corrected p < 0.05 (B). The effect of AD-PRS on global cognitive decline explained by an endophenotype (C). The sets of endophenotypes explain the effect of AD-PRS on global cognitive decline. The endophenotypes connected with a vertical line indicates the set of variables that made relationship between AD-PRS and global cognitive decline independent (p > 0.05) (D). Traits map based on genetic associations. The trait map is generated by calculating the distance between traits in terms of genetic associations. The distance between traits was calculated using the Jaccard index and projected on to two-dimensional by t-SNE (E). Heatmap of trait-SNP associations. The SNPs in the AD-PRS were clustered using the SpeakEasy consensus clustering method (F). GO enrichment map for SNP clusters. GO enrichment for SNP clusters were conducted using the GREAT algorithm and the significant associations (FDR < 0.05) were visualized by EnrichmentMap.

