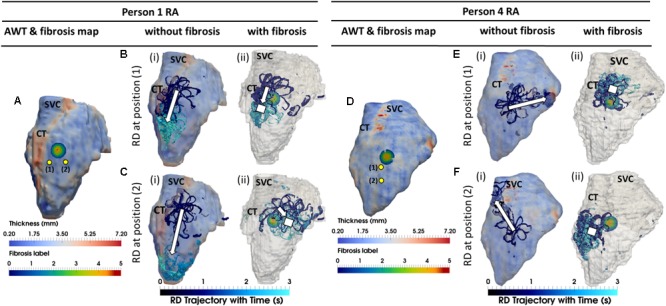
FIGURE 6.

Competing effects of AWT and fibrosis in the RA. The RD trajectories (blue) in the RA, obtained by initiating RDs at two locations (yellow dots) without and with the presence of fibrosis are overlaid on the maps of AWT and fibrosis distribution, respectively, for Persons 1 (A) and 4 (D). In Person 1 in the absence of fibrosis, RDs initiated at both locations (Bi,Ci) drifted toward the CT region with a large AWT gradient. However, in the presence of fibrosis, RD initiated at position 1 anchored between the CT and fibrotic patch (Bii), and while RD initiated at position 2 anchored to the patch (Cii) which was located further away from the CT region. In Person 4 in the absence of fibrosis, RDs initiated at both positions (Ei,Fi) neither drifted toward the thin CT nor showed any anchoring. In the presence of fibrosis, RDs initiated at both positions (Eii,Fii) anchored to the fibrotic patch. SVC, superior vena cava. White squares mark locations where the RDs anchored.
