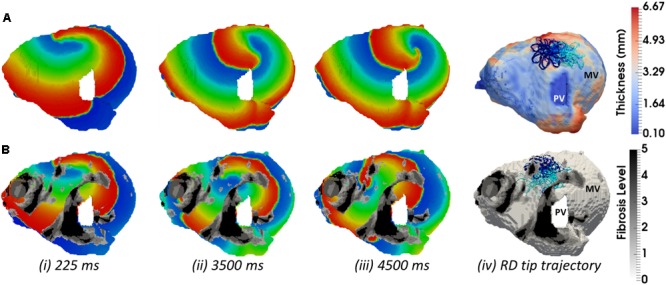
FIGURE 9.

Competing effects of AWT and fibrosis in the LA. The voltage map for RD initiated at Position 2 (shown in Figure 8A) are shown at different moments of time (i–iii). Rows A and B correspond to simulations without and with fibrosis, respectively. For each simulation, the RD tip trajectories (blue) are overlaid on their corresponding AWT and fibrosis map (iv). (A) RD initiated without fibrosis drifts along the large AWT gradient at the LA roof, while in the presence of fibrosis (B), the same RD anchors to the fibrotic patch.
