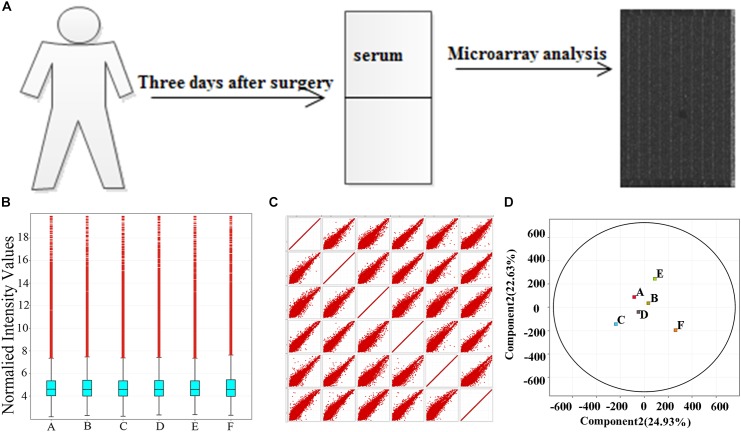
FIGURE 1.
Samples self-test. (A) The workflow of the study. (B) Box–whisker plot shows the dispersion. (C) Scatter plot shows the total trend of dispersion. (D) PAC shows the rationality of POCD group (labeled A, B, C) and non-POCD group (labeled D, E, F). POCD, postoperative cognitive dysfunction. A, B, and C in the images represent three samples in POCD group, and D, E, and F represent three samples in non-POCD group.

