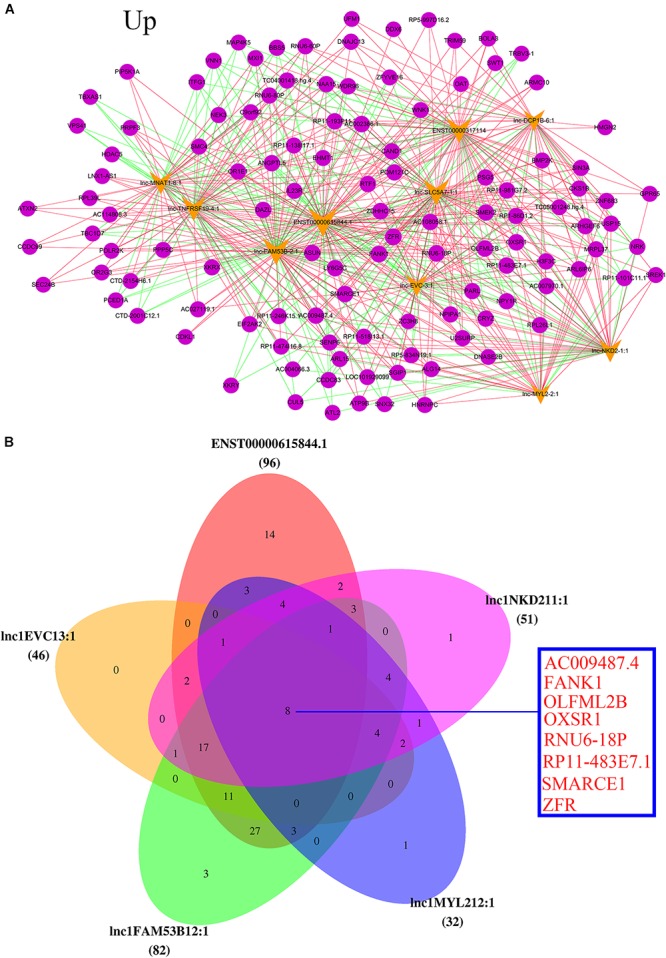
FIGURE 5.

Analysis of upregulated lncRNAs-mRNA co-expression. (A) The top 10 upregulated of regulatory network. Blue nodes represent lncRNAs and yellow nodes represent target genes. The pink lines represent positive correlations and the green lines represent negative correlations. (B) Top five upregulated lncRNAs co-regulated mRNA.
