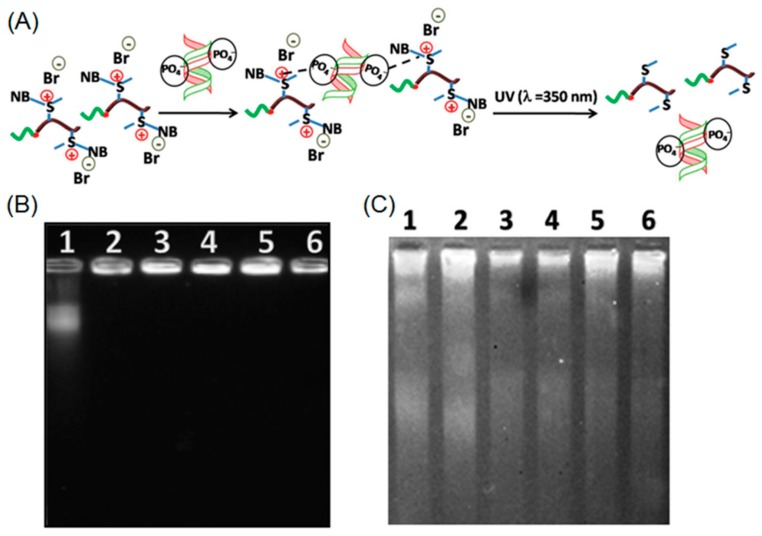
Figure 9.
(A) Schematic illustration of polypeptide-DNA complexation and UV-induced release of DNA; (B) electrophoretic mobility of polypeptide-DNA conjugates at different concentrations of cationic polypeptide before UV irradiation; and (C) electrophoretic mobility of polypeptide-DNA conjugates upon UV treatment. Note: lanes 1–6 correspond to 12.7 mM ctDNA complexing with polypeptide at 0, 0.2, 0.4, 0.6, 0.8, and 1.0 mM, respectively. Reproduced with permission from [73].

