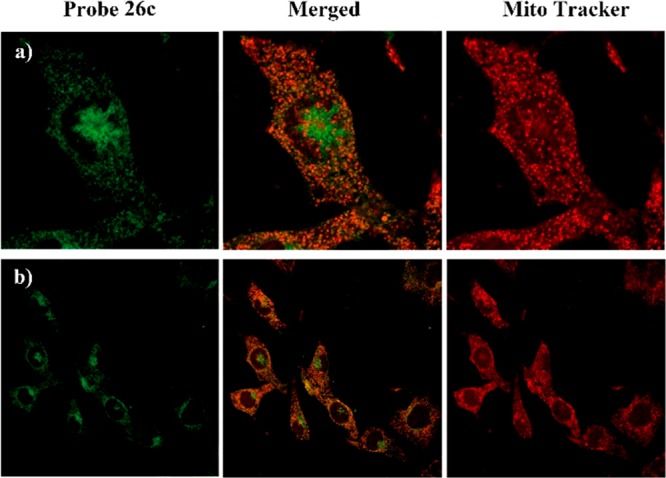
Figure 2.

Subcellular colocalization of probe 26c with MitoTracker (mitochondria specific dye) in B16F10 cells. Images were collected using confocal microscopy with excitation of probe 26c at λex= 415 nm and emission at λem= 475 nm, MitroTracker at λex= 579 nm and emission at λem= 600 nm. Images are provided with amplification factor (a) enlarged view of representative cells, 60×, (b) 40×.
