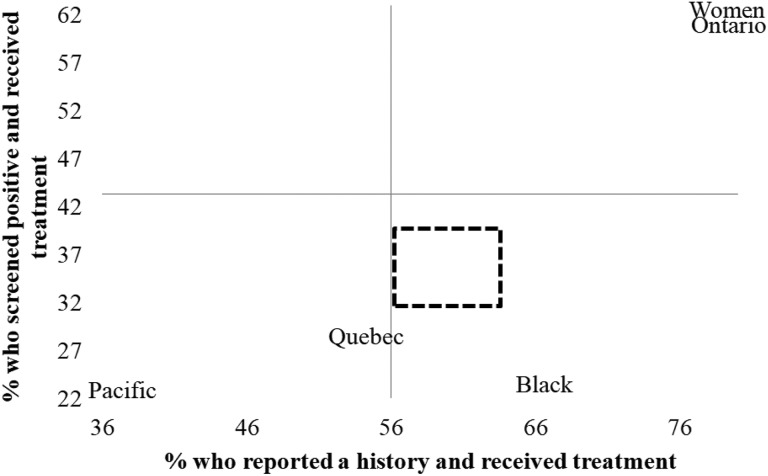
Figure 2.
Observed treatment rates for those self-reporting a recent history or needs on screening versus the expected rate (i.e., positive predictive value) shown by the axes. All groups not displayed in the figure fall within the dashed rectangle. Differences for these groups in the adjusted models (Table 3) were not statistically significant.

