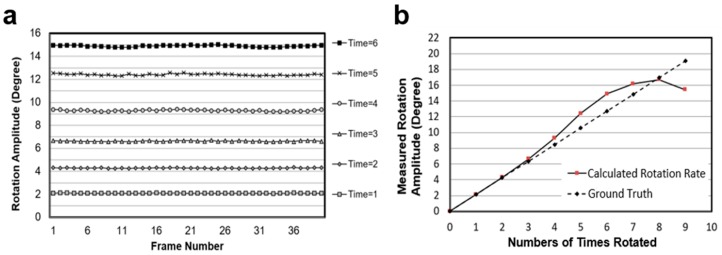
Figure 7.
Evaluation of optical flow algorithm based Baker’s test template. (a) The rotation amplitude of the ball in different image sequences. In the legend, ‘Time = n’ represents how many times the rotation amplitude of the image sequence is that between two adjacent images, and n is the difference between the frame numbers; and (b) the comparison between the ground truth and the calculated rotation velocity on different testing sequences. The calculated rotation velocity is the average value of the same sequence.

