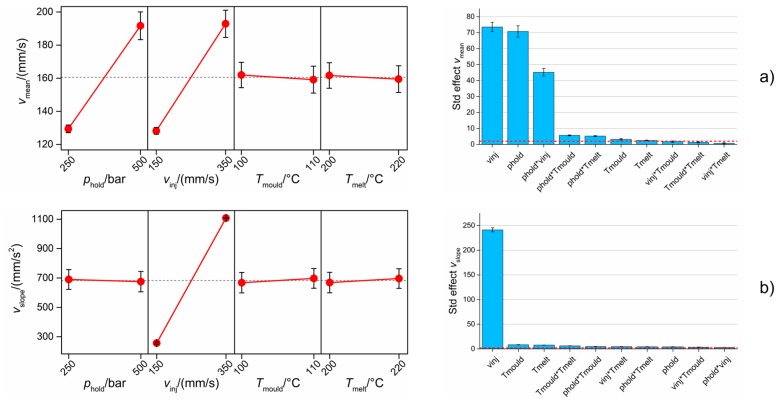
Figure 16.
Influence of µIM process on the two process fingerprint candidates derived from monitored injection velocity curves: (a) vmean and (b) vslope. Main effects plot (left column) and Pareto chart of standardized effects (right column) are reported. The interval bars represent the standard errors in the main effects plots and the standard deviations of five Pareto analyses for the five DoE replicates in the Pareto charts. The red dashed line in the Pareto chart is the significance level at 95% of confidence level.

