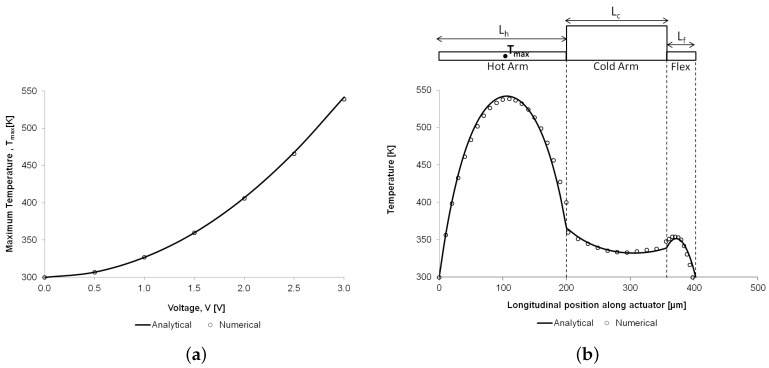
Figure 12.
Comparison of the analytical and numerical results for the temperature distribution on the microgripper structure: variation of the maximum temperature on the hot arm as a function of the applied potential (a), and temperature profile along the hot arm, cold arm and flexure components at 3 V (b). For illustration purposes, the diagram above the graph in (b) shows a thermal actuator (without the extending microgripper arms) as if it were unfolded.

