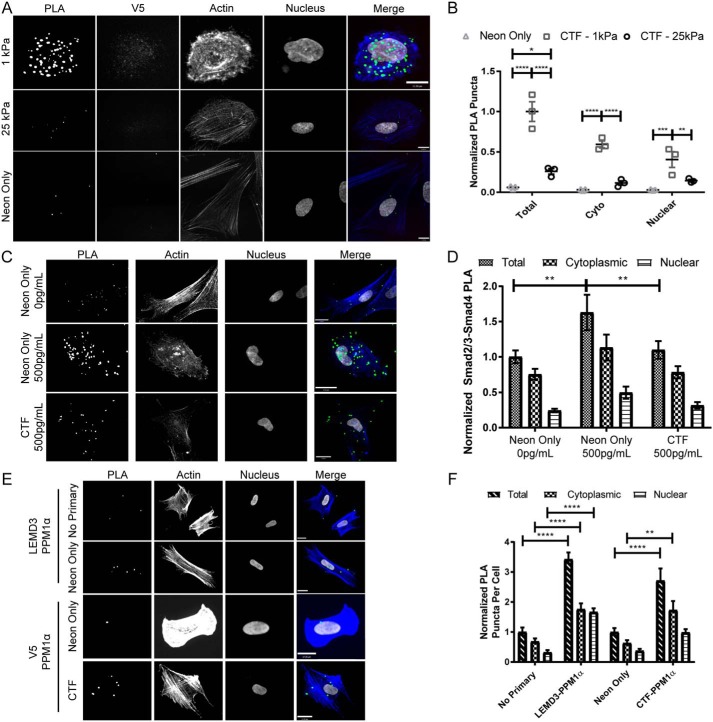
Figure 5.
C-terminal fragments of LEMD3 bind Smad2/3 and antagonize Smad2/3–Smad4 complexes. A, representative images of V5–Smad2/3 PLA reactions imaged in fibroblasts transfected with pFLAG–LEMD3p.Δ21–669–V5 (top two rows) and electroporation control cells (bottom row, neon only) on 1-and 25-kPa hydrogel surfaces (PLA in green, f-actin in blue, V5 in red, and nucleus in white). B, PLA interactions from A between the V5 tag of a C-terminal fragment of LEMD3 (pFLAG–LEMD3p.Δ21–669–V5) and Smad2/3, normalized to the total interactions observed on 1-kPa hydrogels. HFFs on 1-kPa hydrogels have significantly more interactions overall (p < 0.0001), in the cytosol (p < 0.0001), and in the nucleus (p = 0.0082) relative to fibroblasts on 25-kPa hydrogels. All transfected cells had more PLA interactions than electroporation-only (neon) populations (p < 0.0001 and p < 0.0227 for 1- and 25-kPa hydrogels, respectively). Scale bars, 11 μm. All statistical testing done with two-way ANOVA with Tukey's post-test. C, representative images from HFFs on 1-kPa hydrogels assayed for Smad2/3–Smad4 interactions. Cells in the 2nd and 3rd rows were treated with 500 pg/ml TGFβ for 1 h before fixation, whereas cells in the 1st row were untreated. Cells in the 3rd row were electroporated with pFLAG–LEMD3p.Δ21–669–V5, and cells in the top two rows were electroporation control cells (PLA in green, f-actin in blue, and nucleus in white). All scale bars, 17 μm. D, normalized quantification of data from C. Fibroblasts treated with 500 pg/ml TGFβ and overexpressing the CTF of LEMD3 had significantly fewer Smad2/3–Smad4 complexes than untransfected cells treated with 500 pg/ml TGFβ (p = 0.0081). Untransfected TGFβ fibroblasts treated with 500 pg/ml also had significantly more Smad2/3–Smad4 complexes than untransfected fibroblasts (p = 0.001). All statistical testing done with a two-way ANOVA with Tukey's post-test. E, interactions between PPM1α and endogenous LEMD3 or its CTF assayed by PLA on glass surfaces. The 1st and 2nd rows used antibody pairs between PPM1α and endogenous LEMD3. The 3rd and 4th rows used antibody pairs between PPM1α and V5 tag on cells transfected with pFLAG–LEMD3p.Δ21–669–V5 (PLA in green, f-actin in blue, and nucleus in white). All scale bars are 17 μm. F, normalized quantification of the interaction rates between LEMD3 or its CTF by subcellular compartment. Both endogenous LEMD3 and its CTF interacted with PPM1α as demonstrated by PLA frequencies above their respective negative controls (for total interactions: p < 0.0001 for both LEMD3 versus no primary and for CTF versus neon only, respectively). Both LEMD3 and CTF transfected cells also had significantly higher PPM1α interaction rates than their respective controls in the cytoplasm (for cytoplasmic rates: p < 0.0001 and p = 0.0081 for LEMD3 and CTF pairs, respectively), but only endogenous LEMD3 had statistically significant higher interaction rate in the nucleus (for nuclear rates: p < 0.0001 and p = 0.2569 for endogenous LEMD3 and CTF-expressing fibroblasts, respectively). All statistical testing was performed by a two-way ANOVA with Sidak's post-test. All data represented by the mean with S.E. *, p ≤ 0.05; **, p ≤ 0.01; ***, p ≤ 0.001; ****, p ≤ 0.0001.

