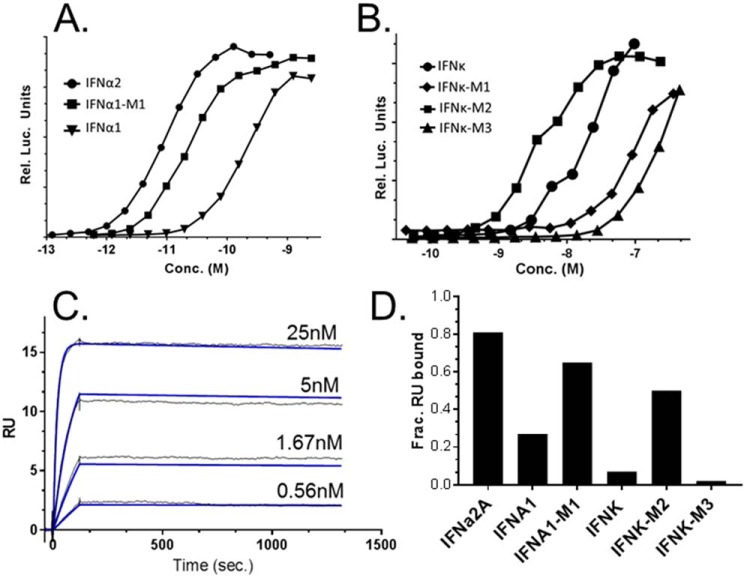
Figure 7.
Bioactivity and B18R-binding properties of IFNα1 and IFNκ mutants. A and B, representative dose-response curves from ISFG3 reporter cell assays performed using IFNα1/IFNα1-M1 (A) and IFNκ/IFNκ-M1/IFNκ-M2/IFNk-M3 (B). The EC50 values for all mutants are shown in Table 2. SPR sensorgrams for IFNα1-M1 binding to B18R are shown (C). Experimental (black) and calculated (blue) sensorgrams, used to derive kinetic parameters in Table 2, are shown. Kinetic parameters for IFNκ and IFNκ-M2/B18R interactions could not be uniquely determined from the sensorgrams. To compare their binding properties, 5 nm concentrations of the IFNs were injected over the B18R-FC surface (D). Binding is reported as fraction RU bound as described in the legend to Fig. 5.

