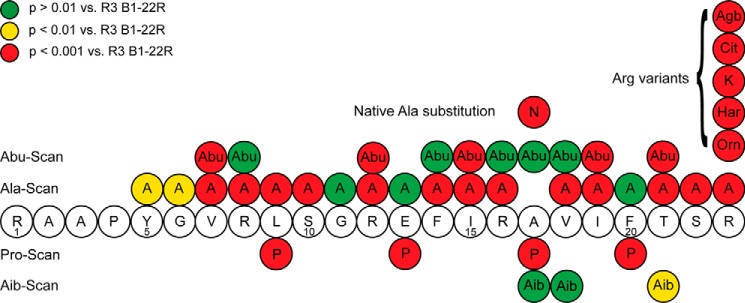
Figure 5.
Summary of the SAR data from point substitutions in R3 B1-22R. Substitutions resulting in a drop of binding p > 0.01 versus R3 B1-22R are shown in yellow circles, and substitutions resulting in a drop in affinity p > 0.001 versus R3 B1-22R are shown in red circles. No changes to Arg23 were tolerated.

