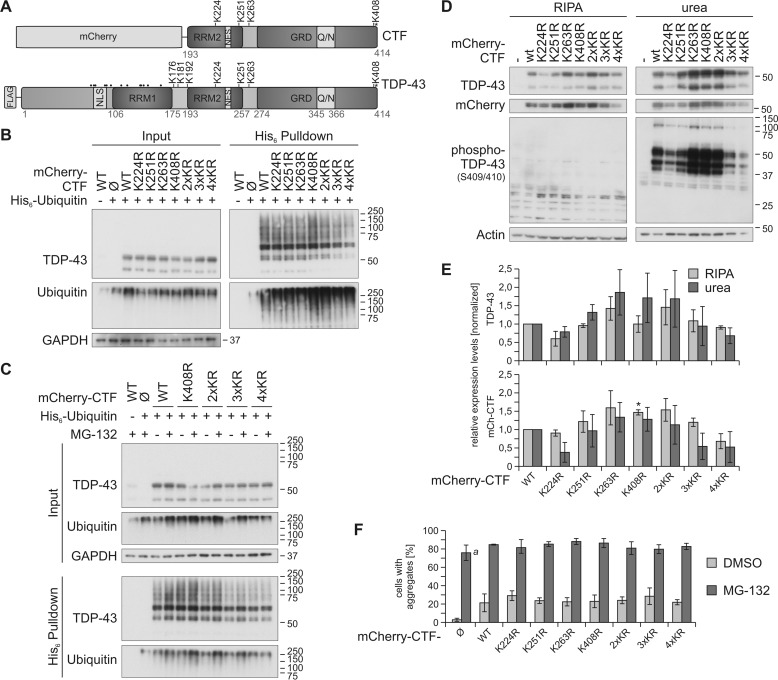
Figure 1.
Site-specific ubiquitinylation of C-terminal lysine residues. A, schematic overview of the mCherry-CTF and FLAG–TDP-43 constructs used in this study. The positions of all 20 lysine residues are depicted; C-terminally located lysine residues are indicated with K, and all other lysine residues are indicated with dots. The phosphorylation site Ser-409/410 is labeled with asterisks. Q/N, glutamate/asparagine-rich prion-like region; and NLS, nuclear localization signal (aa 82–98). B, His6-ubiquitin was co-expressed with mCherry-control (Ø), mCherry-CTFWT, or the indicated mCherry -CTF lysine mutants in HEK293E cells. Cells were lysed harshly with 8 m urea lysis buffer followed by Ni-NTA–affinity purification of His6-ubiquitin–conjugated proteins, and total protein and eluates were analyzed by Western blotting with antibodies detecting TDP-43, ubiquitin, and GAPDH. C, HEK293E cells were transfected with His6-ubiquitin and mCherry-CTFWT, mCherry-CTFK408R, and mCherry-CTFK2/3/4R. After proteasomal inhibition with MG-132 for 2 h, cells were lysed and analyzed as in B. D, sequential extraction of HEK293E cells overexpressing mCherry-CTF lysine mutants and quantification. After 2 days of mCherry-CTF expression, RIPA- and urea-soluble fractions were prepared and analyzed by Western blotting with antibodies against TDP-43, mCherry, and phospho-TDP-43 (Ser-409/410) and actin as loading control. E, quantification of protein levels detected with anti-TDP (upper graph) and anti-mCherry (lower graph), respectively. Data represent the mean ± S.D.; *, p ≤ 0.05 compared with mCherry-CTFWT. F, quantification of the aggregate formation of mCherry-CTF lysine mutants upon proteasomal inhibition (Fig. S1, A and B). 50–250 cells per condition of two independent experiments were analyzed for aggregate formation. The mCherry protein alone formed many tiny aggregates upon proteasomal inhibition, which were included in the quantification (a). Data represent the mean ± S.D.

