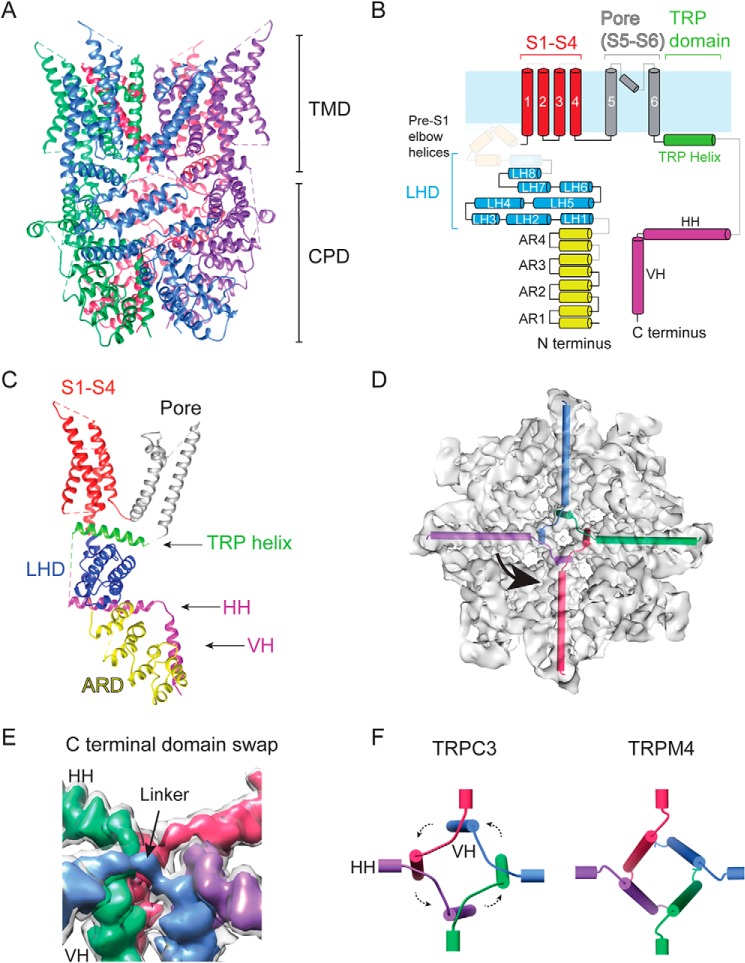
Figure 3.
Detailed structural features of TRPC3. A, ribbon diagram of the TRPC3 model built from the EM density map shown in Figs. 1C and 2D with the four subunits in blue, green, pink, and purple. B, cartoon representation of the secondary structure organization of a single TRPC3 subunit. ARD is in yellow, LHD is in blue, transmembrane helices are in red (S1–S4) and gray (S5, pore helix, and S6), the TRP domain helix is in green, and the C-terminal helices are in pink. Light blue represents the plasma membrane. Regions not resolved in the structure are shaded out. C, the ribbon diagram structure of a single TRPC3 subunit. The domains are color-coded in the same way as in B. D, top view of TRPC3 with HHs and VHs represented by cylinders inside the electron density map, highlighting the C-terminal helices' domain swaps. E, close-up look at the domain swap that occurs at the intersection of the HHs and VHs. The map is displayed at two threshold levels with the four-subunit map in light gray and four different subunits in colors showing the connection between the HHs and VHs. F, cylindrical representation of the intersection of the four HHs and VHs of TRPC3 (left) and TRPM4 (right; PDB code 6BCL). Note the lack of domain swap in TRPM4.

