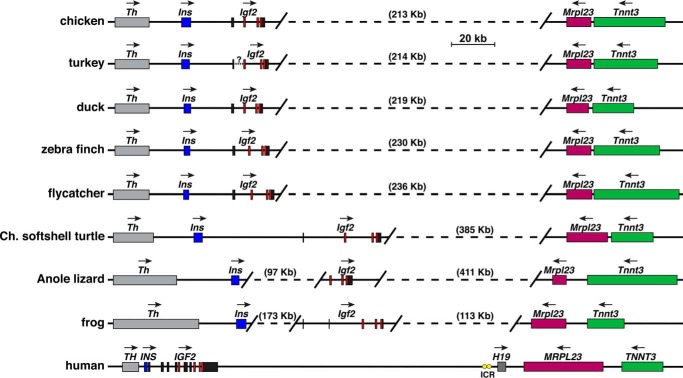
Figure 13.
Igf2 gene and locus in terrestrial vertebrates and human. Diagrams of chicken Igf2, seven other terrestrial vertebrate Igf2 loci, and the human IGF2–H19 locus are shown. For Igf2 and IGF2, individual exons are depicted as boxes (black noncoding, red coding). Other genes are shown as single boxes and include TH/Th, INS/Ins, H19, MRPL23/Mrlp23, and TNNT3/Tnnt3. A horizontal arrow labels the direction of transcription for each gene. Yellow ovals depict the ICR located 5′ to human H19. Scale bar is shown. Angled parallel lines indicate discontinuities, with the distances being spanned in parentheses.

