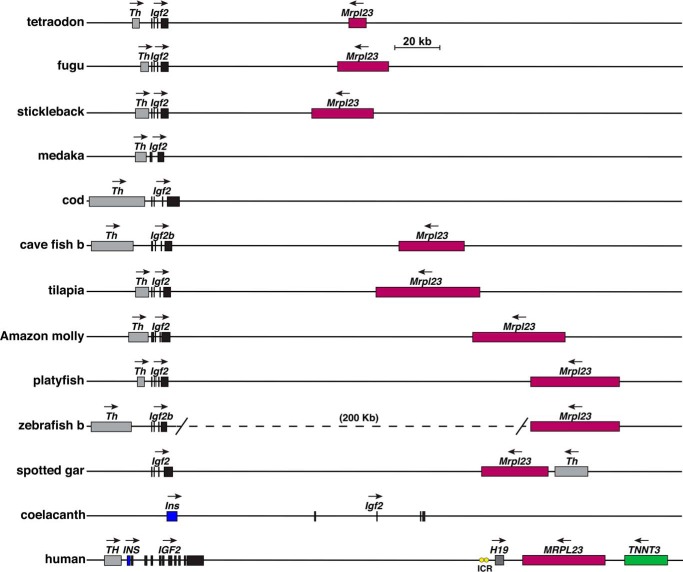
Figure 14.
Igf2 gene and locus in fish and human. Diagrams are shown for the tetraodon Igf2 locus, cave fish, and zebrafish Igf2b loci, nine other fish Igf2 loci, and the human IGF2–H19 locus. For Igf2 and IGF2, individual exons are depicted as boxes. Other genes are indicated as single boxes and include TH/Th, INS/Ins, H19, MRPL23/Mrlp23, and TNNT3/Tnnt3. A horizontal arrow shows the direction of transcription for each gene. Yellow ovals depict the ICR 5′ to human H19. Scale bar is shown.

