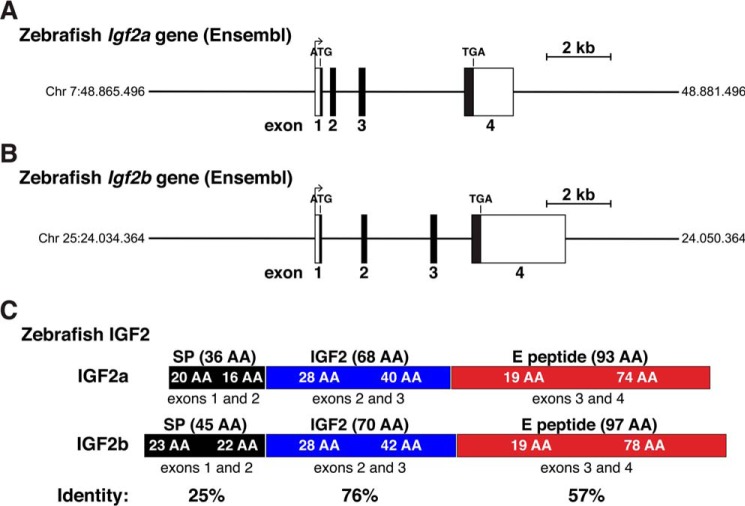
Figure 4.
Organization of zebrafish Igf2 genes. A, map of the zebrafish Igf2a gene from the Ensembl genome database. B, map of the zebrafish Igf2b gene from Ensembl genome database. A and B, chromosomal coordinates are labeled; exons appear as boxes; introns and flanking DNA are horizontal lines; potential transcription start sites, polyadenylation sites, and locations of ATG and TGA codons are marked; and a scale bar is indicated. C, diagram of zebrafish IGF2 protein precursors, illustrating the derivation of each segment from different Igf2a or Igf2b exons. Mature IGF2 is in blue; signal peptides are in black; and E peptides are in red. Percent identities between each part of IGF2a and IGF2b are indicated.

