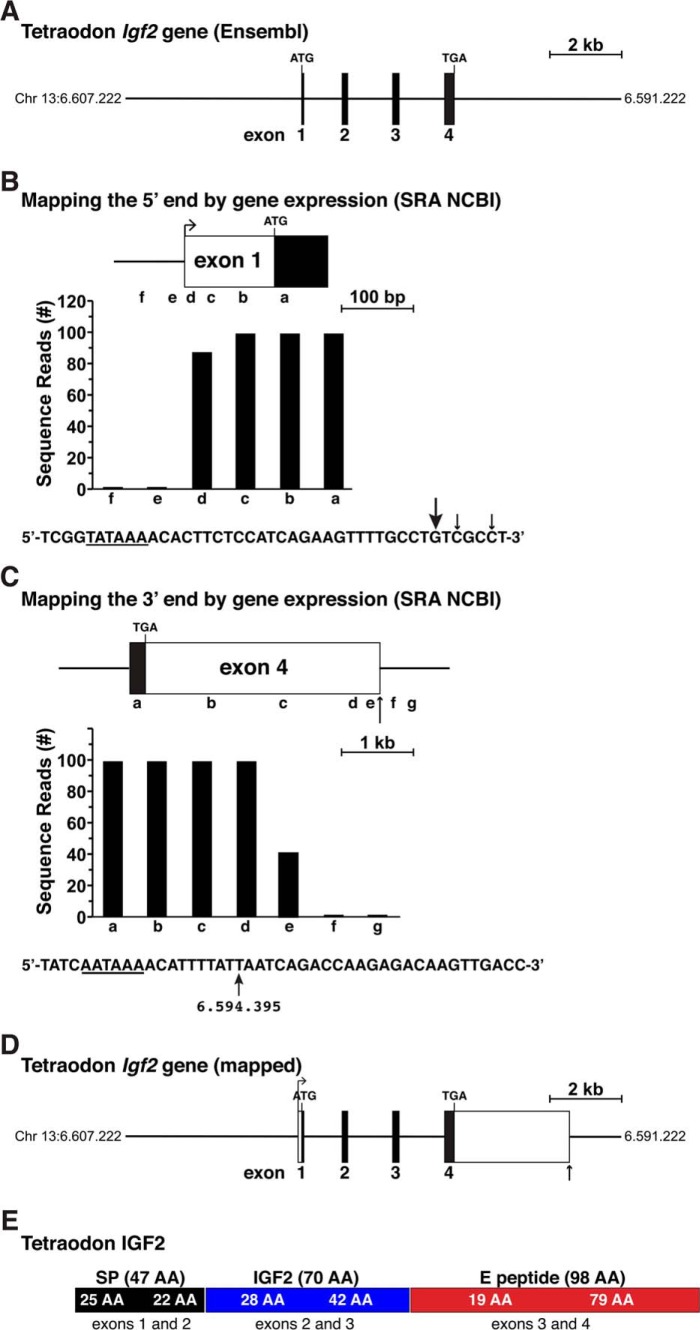
Figure 5.
Structure of the tetraodon Igf2 gene. A, map of the tetraodon Igf2 gene as found in the Ensembl genome database. Chromosomal coordinates are labeled, and exons appear as boxes and introns and flanking DNA as horizontal lines. Locations of ATG and TGA codons are marked; and a scale bar is shown. B, mapping the 5′ end of tetraodon Igf2 with gene expression data from RNA-Seq library, ERX1054374, and 60 bp genomic segments a–f as probes. The DNA sequence below the bar graph illustrates the putative 5′ end of exon 1, with locations of the 5′ ends of the longest RNA-seq clones indicated by arrows (arrow size is proportional to the number of clones identified). A possible TATA box is underlined. C, characterizing the putative 3′ end of tetraodon Igf2 exon 4 using data from RNA-Seq library, ERX1054374, and 60-bp genomic segments a–g as probes. A possible polyadenylation signal is underlined in the DNA sequence below the graph, and the vertical arrow denotes a potential 3′ end of Igf2 mRNAs with its chromosomal coordinate. D, structure of the tetraodon Igf2 gene based on the analyses shown in B and C. Labeling is as in A. E, diagram of the tetraodon IGF2 protein precursor, with the derivation of each segment from different Igf2 exons indicated. Mature 70-amino acid IGF2 is in blue; the signal peptide is in black; and the E peptide is in red.

