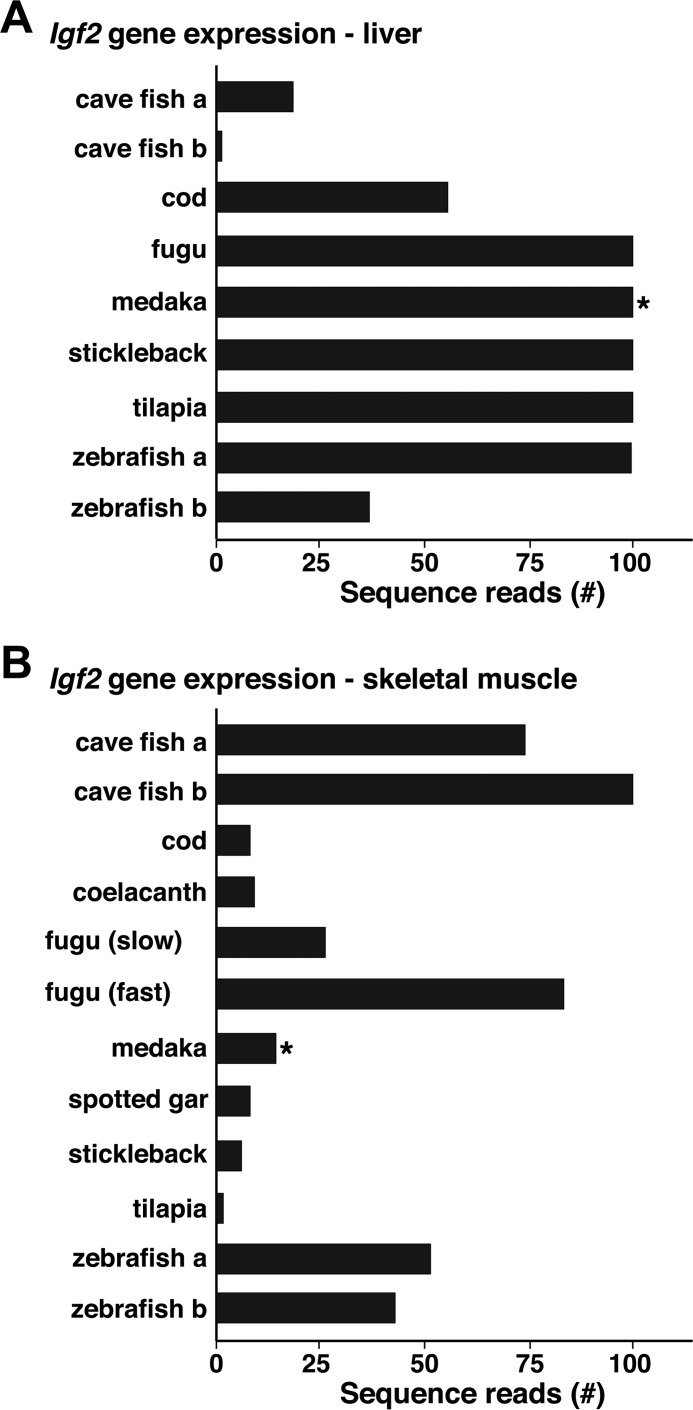
Figure 9.
Igf2 gene expression in fish. Igf2 transcript levels were identified in liver (A) and in skeletal muscle (B) by querying RNA-Seq libraries using 60-bp genomic DNA segments from a region equivalent in each species to the same part of tetraodon Igf2 exon 2 (or * exon 3 in medaka). Results are plotted as the number of sequence reads per species (range = 0–100). Information was not available from either liver or muscle for Amazon molly, platyfish, or tetraodon or for liver for coelacanth. A and B, libraries searched are listed under “Experimental procedures.”

